Graphics Reference
In-Depth Information
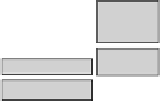
Figure
.
.
Pairs plot for the UCB admissions data
Model-Based Displays
for Conditional Independence Models
12.4.2
Inaddition tothe exploratory approachestothe visualization of multiway tables out-
lined in the previous section, there are specialized displays that are designed for the
visualization of conditional independence structures.
One approach is to use pairs plots (such as in Fig.
.
) to search for the model;
we can use the positions of the cells in the pairs matrix to select an independence
model and add corresponding shading to the tiles to visualize the residuals. More
precisely, each cell a
ij
in such a matrix defines two variables i and j that can be used
to specify the model visualized in that cell. Typical hypotheses are: variables i and j
are marginally independent; variables i and j are conditionally independent, given
all others; variables i and j are jointly independent from all others.
Another approach is to visualize (the deviations from) a particular fitted model
using ideas similar to those described in Sect.
.
. hus, mosaic displays can be ex-
tended from purely explorative views to model-based views of the data by residual-
based shadings, and association plots can directly visualize deviations from a given