Graphics Reference
In-Depth Information
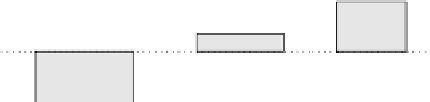
Figure
.
.
Association plot with Friendly-like color coding of the residuals
α
.
levels. However, the main purpose of this shading is not to
visualize the significance but the pattern of deviation from independence (Friendly,
). In addition to the shading of the rectangles themselves, the Friendly shading
also encompasses a choice of line type and line color for the rectangle borders with
similar ideas to those described above.
In Fig.
.
, we again show the mosaic for the hospital data, this time using
a Friendly-like color shading (with HCL instead of HSV colors, and no line type
coding). Clearly, the asymmetry for regular and never visited patients as well as the
pattern inversion for lengths of stay of
-
and more than
years are emphasized
using the color shading.
For association plots, residual-based shadings are redundant since all relevant in-
formation is already contained in the plot by construction. Nevertheless, the use of
oneofthe shadings discussedabove will supportthe analysis processandistherefore
recommended. For example, applying the Friendly shading in Fig.
.
on the one
hand facilitates discrimination between positive and negative residuals, and on the
other hand,moreimportantly, makesiteasier tocomparetilesizes.hus,theshading
supports the detection of the pattern.
=
.
and α
=
Visualizing Test Statistics
12.3.3
Figures
.
and
.
include the (same) p value for the χ
test of independence,
whichis frequently used to assess the significance of the hypothesis of independence