Graphics Reference
In-Depth Information
Figure
.
.
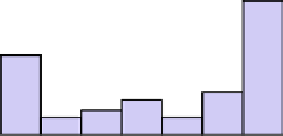
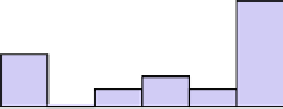
Rootograms of the posterior cluster probabilities. Cluster three is highlighted by selecting
those cases with posteriors that are larger than
.
Projecting the five components onto two combinations of the original variables,
as done in Fig.
.
, provides more detail. In these plots, the original data have been
omitted todrawmoreattention tothe fitted model.Both plots have a similar pattern,
which is more heavily emphasized in the upper panel (FDP vs. CDU/CSU). hese
two parties were potential coalition partners before the election and have a positive
correlation in four of the five clusters. he only cluster with a negative correlation is
cluster number three (mainly Bavaria and Baden-Württemberg), the stronghold of
CDU/CSU. In this cluster, every vote for another party seems to be at the expense of
CDU/CSU,suchthat theyhaveanegative correlation withallotherparties,including
the FDP.
he same is true for the SPD in cluster three, the only cluster where they have
a strong negative correlation with their potential coalition partner, GRUENE. From
thetwoplotswealsoseeoneofthemaindifferencesbetweenthetwoeasternclusters:
in cluster four CDU/CSU and FDP have a strong positive correlation, while in clus-