Graphics Reference
In-Depth Information
Figure
.
.
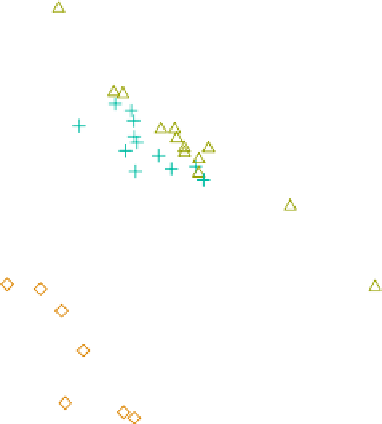
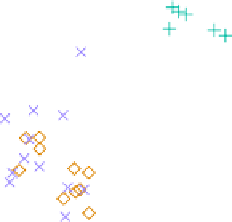
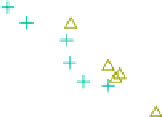
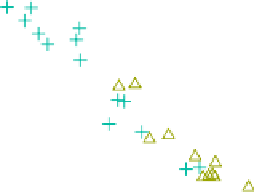
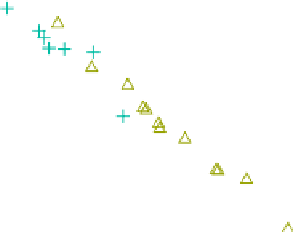
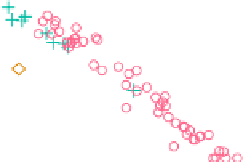
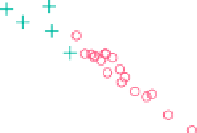
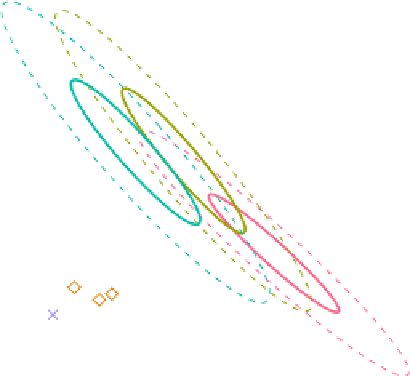
A five-cluster finite mixture model for the German election data projected on the first two
principal components
histograms; the only difference between them is that the bar height corresponds to
thesquarerootofthecountsratherthanthecountsthemselves,solowcountsbecome
morevisibleandtheemphasisonpeaksisreduced.
Usuallymanyoftheobservationsineachcomponenthaveposteriorsclosetozero,
resulting ina highcount forthe corresponding bin in the rootogram, whichobscures
the information in the other bins. To avoid this problem, all probabilities with a pos-
terior below a particular threshold are ignored (we use
−
). A peak at probability
indicates that a mixture component is well separated from the other components,
whilenopeakat
and/orasignificantmassinthemiddleoftheunitintervalindicates
overlap with other components.
Figure
.
shows that in our example the components are well separated, so the
apparent overlap in Fig.
.
isprobably an artefactof the projection. Inaddition, we
highlight the posteriors of cluster three in the rootograms, which visualizes overlap
with other clusters without using any projection. he largest overlap is with clusters
one and two, but there is also some overlap (one district each) with four and five. Of
course,one would nowproceed to highlight posteriorscorresponding tothe remain-
ing four clusters.