Graphics Reference
In-Depth Information
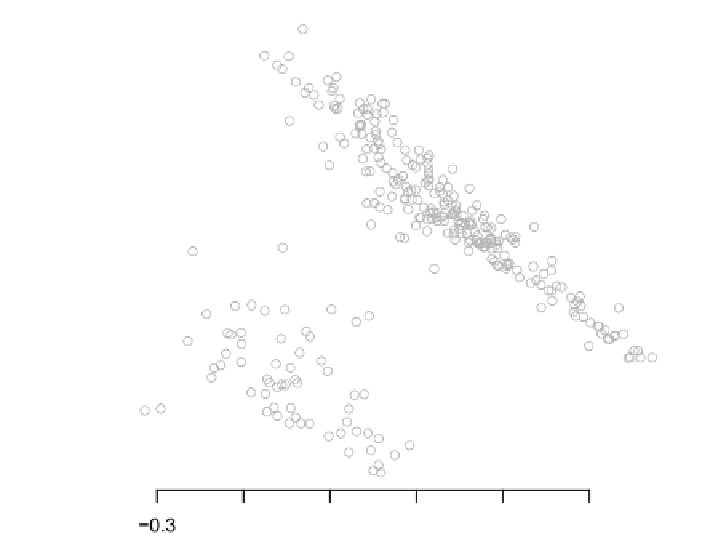
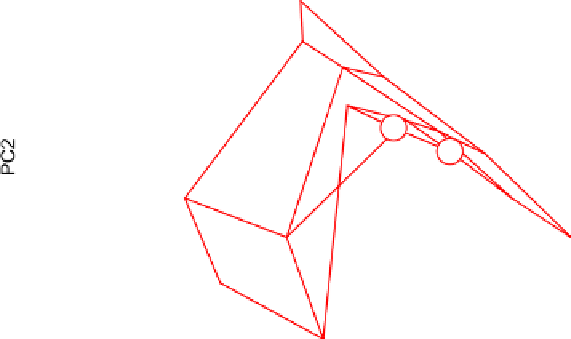
Figure
.
.
rectangular SOM grid projected onto the first two principal components of the
German election data
relative size of each party in the corresponding segment ater rescaling each party
separately. Eastern Germany is represented by clusters nine, ten, thirteen and four-
teen, while the large black pie segements indicate the strong performance of LINKE
in this part of the country.
Model-Based Clustering
11.4
Model-based clustering fits a set of K (usually identical) probabilistic models to the
data set. Ater parameter estimation, each of the K models is interpreted as a cluster,
andthelikelihoodthatadatapointisobserved givenoneofthemodelsagaininduces
a partition in the input space. Consider a finite mixture model with K components
of the following form
K
k
=
h
(
y
x
,w
)=
π
k
f
(
y
x
, θ
k
)
,
(
.
)
K
k
=
π
k
,
π
k
=
,
(
.
)