Graphics Reference
In-Depth Information
Figure
.
.
he
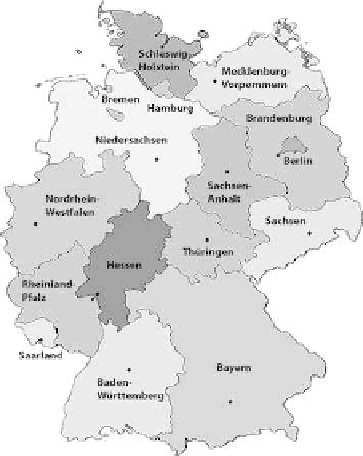
federal states of Germany
Hereweprovideonlyonesimpleexampletodemonstrate thebasicprinciple.Each
electoral district belongs to one of the
German federal states; see Fig.
.
for
a map. Table
.
shows a cross-tabulation of state and cluster membership in a bal-
loon plot (Warnes,
). he state information has not been used in the clustering
process, so we can treat the table as a usual contingency table of two nominal vari-
ables. Figure
.
shows a mosaicplot (Hartigan and Kleiner,
; Friendly,
;
Meyer et al.,
) for the table, see III.
(Meyer et al.) and III.
(Hoffmann) for
more discussion of mosaicplots. Cells with unusually high or low counts (under the
null hypothesis of independenceof columns androws)areshaded.hemoststriking
pattern in the contingency table is that Saarland (located in the southwest of Ger-
many, at the French border) voted in a similar way to the eastern states. his is most
likely due to the fact that Oscar Lafontaine, one of the two leaders of LINKE, is a for-
mer prime minister of Saarland. Another pattern that can be easily spotted from the
mosaicplot is that Nordrhein-Westfalen is not only the largest state, but it also has
districts that exhibit very diverse voting behavior andthus spreadsover all fourwest-
ern clusters.
Self-Organizing Maps
11.3.7
Self-organizing maps (SOMs, Kohonen,
) impose a (typically two-dimensional
rectangular) grid on cluster centroids. he grid is specified before the data are clus-
tered, and centroids that are neighbors on the grid are forced to stay “close” to each
otherduringthecompleteprocedure.hishastheadvantage thattheresultingneigh-
borhood graph can always be easily projected onto two dimensions by simply using