Graphics Reference
In-Depth Information
Figure
.
.
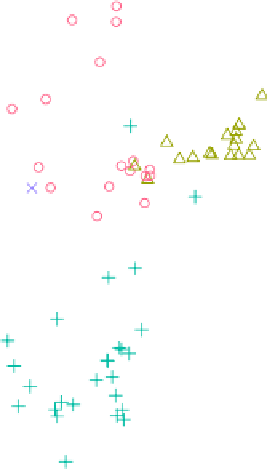
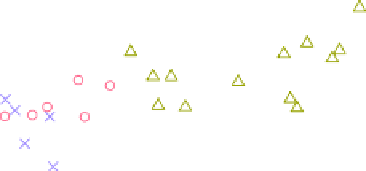
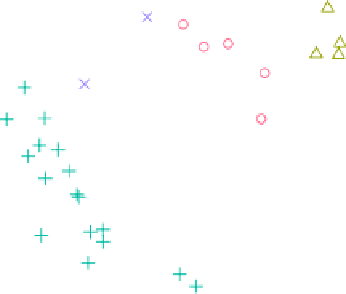
Asymmetric projection seeking to horizontally separate cluster two from the rest
One aspectof the data that can beeasily seen fromFig.
.
isthe negative correla-
tion between SPDand CDU/CSU. In clusterstwo, fourand five, one of these is larger
than the other, while in cluster one and (much more pronounced) cluster three, the
negative correlation isreflectedinthe X-shapeof thelines between thetwo variables.
WealsoseethatforGRUENEtherearethreeoutlierswithhighnumbersofvotesin
cluster three; these correspond to electoral districts in Berlin.
Another way to assess the differences between the clusters is to actively look for
projections that maximize cluster separation, for example using the collection of
methods in Hennig (
). Figure
.
shows a projection using the “asymmetric
neighborhood-based coordinates” method that horizontally separates cluster two
from the others.
Using Background Variables
11.3.6
An important task in many clustering applications is to check whether background
variableshavedifferentdistributionsintheclusters.Bybackground variableswemean
all variables in the data set that have not been used for clustering.Ifavariablehasnot
beenusedforclustering,theusualstatisticalinferencefordifferencesbetweengroups
of observations can be used. he partition itself can be seen as a nominal variable, so
all visualization techniques that can be used to plot a set of variables versus a single
nominal variable are applicable.