Graphics Reference
In-Depth Information
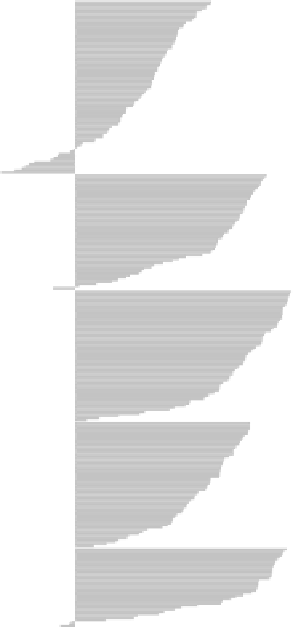
One popular approach to partition diagnostics involves cluster silhouettes and
plots of them (Rousseeuw,
).he basic idea is to compare the distance fromeach
point to the points in its own cluster to the distance to points in the second-closest
cluster: the silhouette value of
x
b
x
a
x
(
)−
(
)
sil
(
x
)=
(
.
)
max
(
a
(
x
)
, b
(
x
))
is defined as the scaled difference between the average dissimilarity a
(
x
)
of
x
to all
points in its own cluster and the smallest average dissimilarity b
to the points of
the second-best cluster. Points with a large positive silhouette value are far from the
second-best cluster, and clusters where many points have large silhouette values are
(
x
)
Figure
.
.
Silhouette plot for the five-cluster PAM partition of the German election data