Graphics Reference
In-Depth Information
Figure
.
.
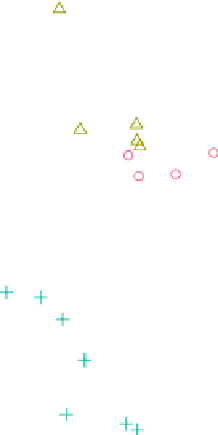
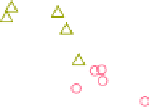
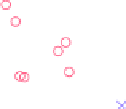
Convex hulls of the five clusters
all data points that are no more than
.
m
k
away from
c
k
; this corresponds to the
whiskers in a boxplot. Points outside this area are considered to be outliers.
Figure
.
shows the convex hull for a five-cluster PAM solution (Kaufman and
Rousseeuw,
;Mächler et al.,
)for the German election data using Euclidean
distance. here seems to be no natural number of clusters in the data set in terms of
within-cluster variance or cluster indices (Milligan and Cooper,
); the two visi-
ble groups in the PCA projection do not explain all aspects of the data. Five clusters
were chosen because this solution yields good results for interpretation. In addition,
model-based clustering selects five clustersbased on BIC (see Sect.
.
), so choosing
the same number of clusters for PAM makes the results (and their structural differ-
ences) easier to compare.
Althoughthefullfive-dimensional datasethasbeenclustered,thepartition agrees
well with the PCA projection, and there is not much overlap between the projected
clusters. Cluster three captures the eastern states, while clusters two, one, four and
five divide up the western states, moving from the large number of votes for the SPD
(cluster two) to the large number of votes for CDU/CSU (cluster five).
The Voronoi Partition
11.3.2
If interested in both assigning the available data points to clusters and partitioning
thewholeinputspace,wecancomputetheso-calledVoronoi partition whichassigns


