Graphics Reference
In-Depth Information
Figure
.
.
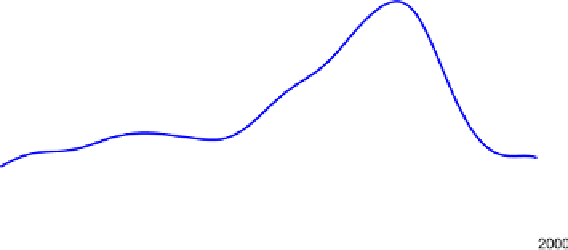
he distribution of milestone items over time, comparing trends in Europe and North
America
Other historical patterns can be examined by classifying the items along various
dimensions (place, form, content and so forth). If we classify the items by place of
development (Europe vs. North America, ignoring Other), interesting trends appear
(Fig.
.
). he greatest peak in Europe around
-
coincided with a smaller
peak in North America. he decline in Europe following the Golden Age was ac-
companied by an initial rise in North America, largely due to popularization (e.g.
textbooks) and significant applications of graphical methods, then a steep decline as
mathematical statistics held sway.
Finally,Fig.
.
showstwomosaicplotsforthemilestoneitemsclassifiedbyEpoch,
Subject matter and Aspect. Subject was classed as having to do with human (e.g.
mortality, disease), physical or mathematical characteristics of what was represented
in the innovation. Aspect classed each item according to whether it was primarily
map-based, a diagram or statistical innovation or a technological one. he let mo-
saic shows the shits in Subject over time: most of the early innovations concerned
physical subjects, while the later periods shit heavily to mathematical ones. Human
topics are not prevalent overall but weredominant in the
th century. heright mo-
saic,forSubject
Aspect,indicatesthat,unsurprisingly,map-basedinnovationswere
mainly about physical and human subjects, while diagrams and statistical ones were
largely about mathematical subjects. Historical classifications clearly rely on more
mentsandoversmoothestheNorthAmericanones.hedetailsdiffer,butmostofthepoints
made in the discussion about what was happening when and where hold.