Graphics Reference
In-Depth Information
Figure IV.
.
.
hree-dimensional visualization of the density evolution of a risk process with respect
to the risk process value R
t
(let axis)andtimet (right axis). he parameters of the risk process are the
same as in Fig.
.
. From the Ruin Probabilities Toolbox
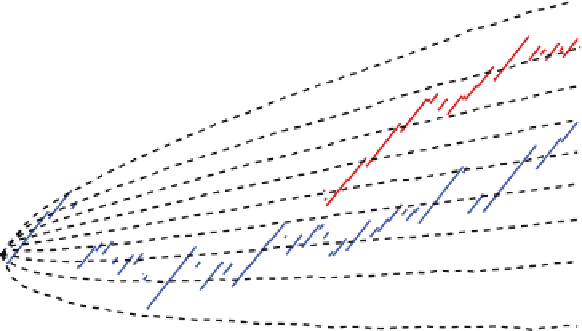
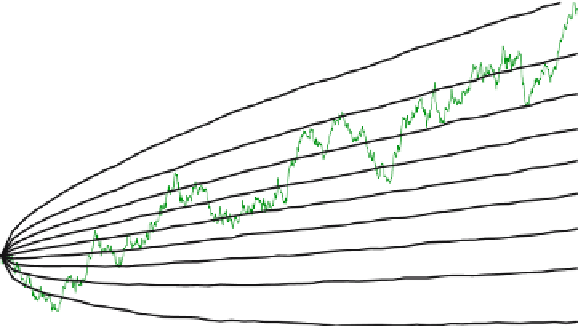
Figure IV.
.
.
A Poisson-driven risk process (discontinuous thin lines) and its Brownian motion
approximation (continuous thin lines). he quantile lines enable an easy and fast comparison of the
processes. he thick solid lines representthesample
.
,...,
.
-quantilelinesbasedon
trajectories of the risk process, whereas the thick dashed lines correspond to their approximation
counterparts. he parameters of the risk process are the same as in Fig.
.
. From the Ruin
Probabilities Toolbox