Graphics Reference
In-Depth Information
Figure IV.
.
.
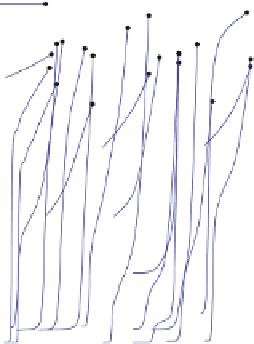
Rug plot displaying the price evolution (y-axis) of
online auctions over calendar
time (x-axis) during a three-month period. he colored lines show the price path of each auction, with
color indicating auction length (yellow,threedays;blue,fivedays;green,sevendays;red,tendays).he
dot at the end of each line indicates the final price of the auction. he black line represents the average
of the daily closing price, and the gray band is the interquartile range


