Graphics Reference
In-Depth Information
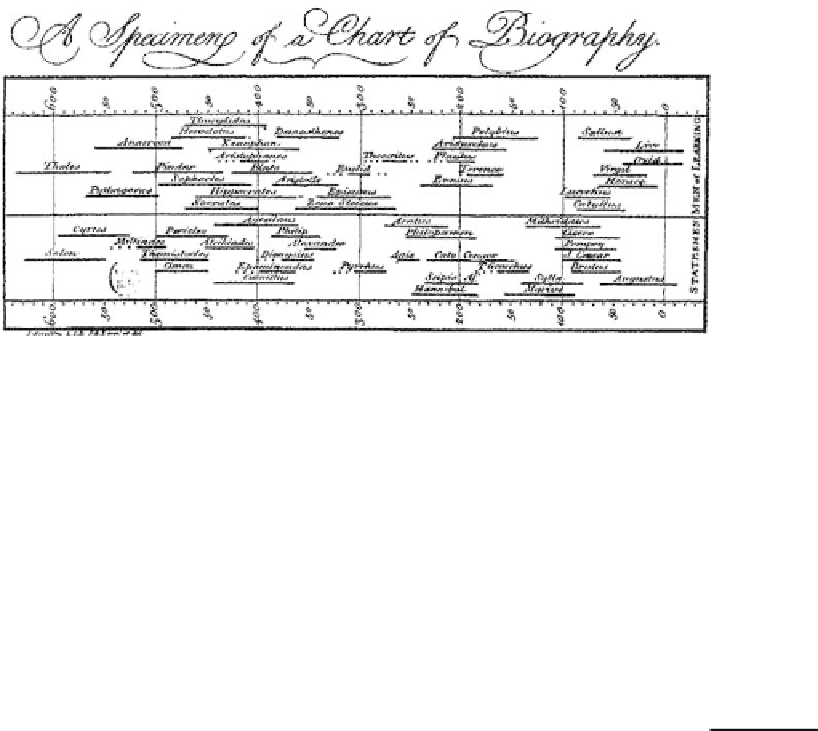
Figure
.
.
A specimen version of Priestley's Chart of Biography. Source:Priestley(
)
Priestley's graphical representations of time and duration apparently influenced
Playfair'sintroduction oftime-serieschartsandbarcharts(Funkhouser,
,p.
).
ButtheseinventionsdidnotinspiretheBritishstatisticiansofhisday,asnotedearlier;
historicalevents andstatistical factswereseenasseparate,ratherthan asdata arrayed
alongatimedimension.In
,attheJubilee meetingoftheRoyalStatistical Society,
AlfredMarshall(
)arguedthatthecausesofhistoricaleventscouldbeunderstood
by the use of statistics displayed by 'historical curves' (time-series graphs): 'I wish to
argue that the graphic method may be applied as to enable history to do this work
better than it has hitherto' (p.
). Maas and Morgan (
) discuss these issues in
more detail.
Analysing Milestones Data
1.3.2
he information collected in the Milestones Project is rendered in print and Web
forms as a chronological list but is maintained as a relational database (historical
items, references, images) in order to be able to work with it as 'data.' he simplest
analyses examine trends over time. Figure
.
shows a density estimate for the distri-
bution of
milestone items from
to the present, keyed to the labels for the
periods in history. he bumps, peaks and troughs all seem interpretable: note par-
ticularly the steady rise up to about
, followed by a decline through the 'modern
darkages' to
,then the steep rise uptothe present. Infact,it isslightly surprising
to see that the peak in the Golden Age is nearly as high as that at present, but this
probably just reflects underrepresentation of the most recent events.
Technical note: In this figure an optimal bandwidth for the kernel density estimate was se-
lected (using the Sheather-Jones plug-in estimate) for each series separately. he smaller
rangeandsamplesizeoftheentriesforEuropevs.NorthAmericagivesasmallerbandwidth
for the former, by a factorof about
. Using a common bandwidth fixed to that determined
for thewholeseries(Fig.
.
) undersmoothesthemoreextensivedata onEuropean develop-