Graphics Reference
In-Depth Information
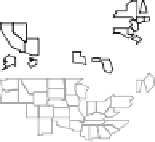
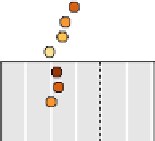
Figure III.
.
.
LM plots, based on data from the NCI Web page, showing summary values for the years
to
and for the years
to
in the let data panel, rates and
% confidence intervals in
the middle data panel, and boxplots for each of the counties of each state in the right data panel