Graphics Reference
In-Depth Information
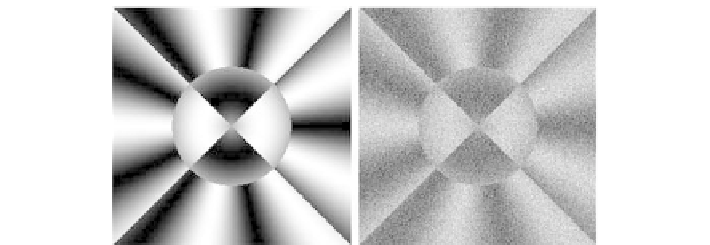
Figure
.
.
Artificial locally smooth image, original (let) and noisy version (right)
he upper row of Fig.
.
provides results obtained by (nonadaptive) kernel, local
linear and local quadratic smoothing (from let to right), employing mean absolute
error(MAE)optimalbandwidths.hesecondrowgivesthereconstructionsobtained
bythecorrespondingAWSandpropagation-separationapproaches,againwithMAE
optimal maximal bandwidths h
max
. he mean absolute error and mean squared er-
ror (MAE) for all six reconstructions together with the employed values of h or h
max
are shown in Table
.
. Adaptive control was not used (τ
)fortheadaptivepro-
cedures. he local constant AWS reconstruction, although clearly an improvement
on all nonadaptive methods, exhibits clear artifacts resulting from the inappropriate
structural assumption used. Also, the quality of this result heavily depends on the
chosen value of h
max
. Both local linear and local quadratic PS allow for more flexi-
bility when describing smooth changes of gray values. his enables us to use much
largermaximalbandwidths,andthereforetoobtainmorevariancereductionwithout
compromising the separation of weights at the edges. he best results are obtained
by the local quadratic propagation-separation algorithm. he bottom row of Fig.
.
again illustrates the sum of weights in each pixel generated in the final step of the
adaptive procedure.
WenowrevisittheexamplefromFig.
.
.hereconstructioninFig.
.
isobtained
by applying the local quadratic propagation-separation algorithm with parameters
adjusted for the spatial correlation present in the noisy image. he maximal band-
width used is h
max
=
. he statistical penalty selected by the propagation condi-
tion for color images with spatially independent noise is λ
=
. his parameter is
again corrected for the effect of spatial correlation at each iteration. Both the MAE
=
Table
.
.
MAE optimal value of h, MAE and MSE for the images in Fig.
.
local constant
local linear
local quadratic
nonadapt. AWS(p
) nonadapt. PS (p
) nonadapt. PS(p
)
=
=
=
h, h
max
5.5
6
5.5
15
10
25
10
2
MAE
3.27
3.02
3.30
2.10
3.44
1.88
MSE
10
3
3.52
2.17
3.52
1.64
3.52
1.64