Graphics Reference
In-Depth Information
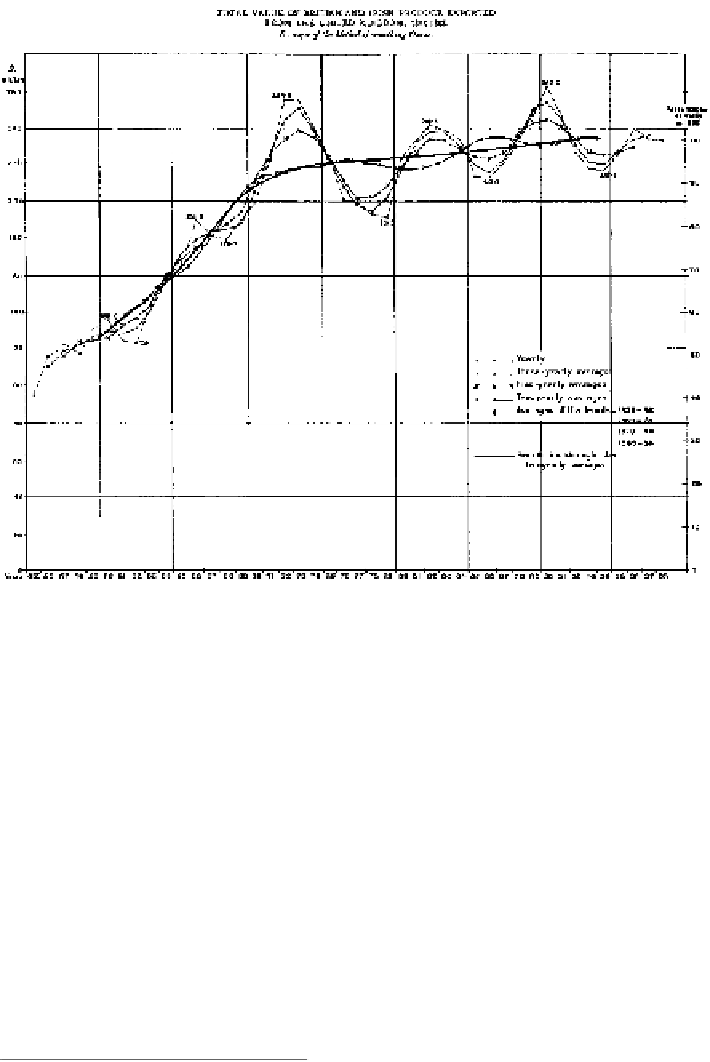
Figure
.
.
Arthur Bowley's demonstration of methods of smoothing a time-series graph. Moving
averages of
,
and
years are compared with a freehand curve drawn through four points
representing the averages of successive
-year periods. Source: Bowley (
, opposite p.
)
without making sudden changes in curvature,' giving the thick curve in Fig.
.
.
Support for Sir Robert's conclusion and the evidence for a
-year cycle owe much to
this graphical treatment.
Moreover, perhaps for the first time, graphical methods proved crucial in a num-
berofnewinsights, discoveries andtheories inastronomy,physics,biologyandother
sciences.Amongthese,onemayreferto(a)E.W.Maunder's(
)'butterflydiagram'
to study the variation of sunspots over time, leading to the discovery that they were
markedly reduced in frequency from
-
; (b) the Hertzsprung-Russell dia-
gram (Hertzsprung,
; Spence and Garrison,
), a log-log plot of luminosity as
a function of temperature for stars, used to explain the changes as a star evolves and
laying the groundwork for modern stellar physics; (c) the discovery of the concept
of atomic number by Henry Moseley (
) based largely on graphical analysis. See
Friendly and Denis (
) for more detailed discussion of these uses.
A reanalysis of the data using a loess smoother shows that this is in fact oversmoothed and
correspondscloselytoaloesswindowwidth of f
=
.
.heoptimalsmoothingparameter,
minimizing AIC
C
is f
=
.
, giving a smooth more like Bowley's
- and
-year moving
averages.