Graphics Reference
In-Depth Information
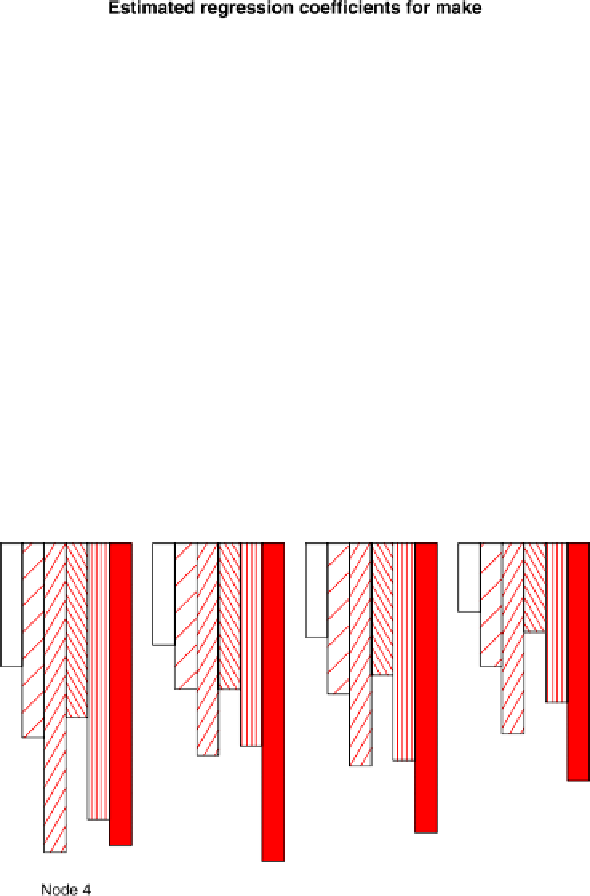
Figure
.
.
Estimated regression coe
cients for Make (above) and Zone (below)
BecauserateofchangeoflogclaimratewithrespecttoBonusandMileageclass
depends on the levels of Make and Zone, the best way to visualize the effects is to
drawa contour plot of the fitted modelfor each combination of Make and Zone. his
is done in Fig.
.
for four level combinations, those corresponding to the best and
worst levels of Make and Zone. We see that claim rate is highest when Mileage class
is
, Bonus class is
, Make is
, and Zone is
. he lowest claim rates occur for Make
level
and Zone level
, more or less independent of Mileage and Bonus class.