Graphics Reference
In-Depth Information
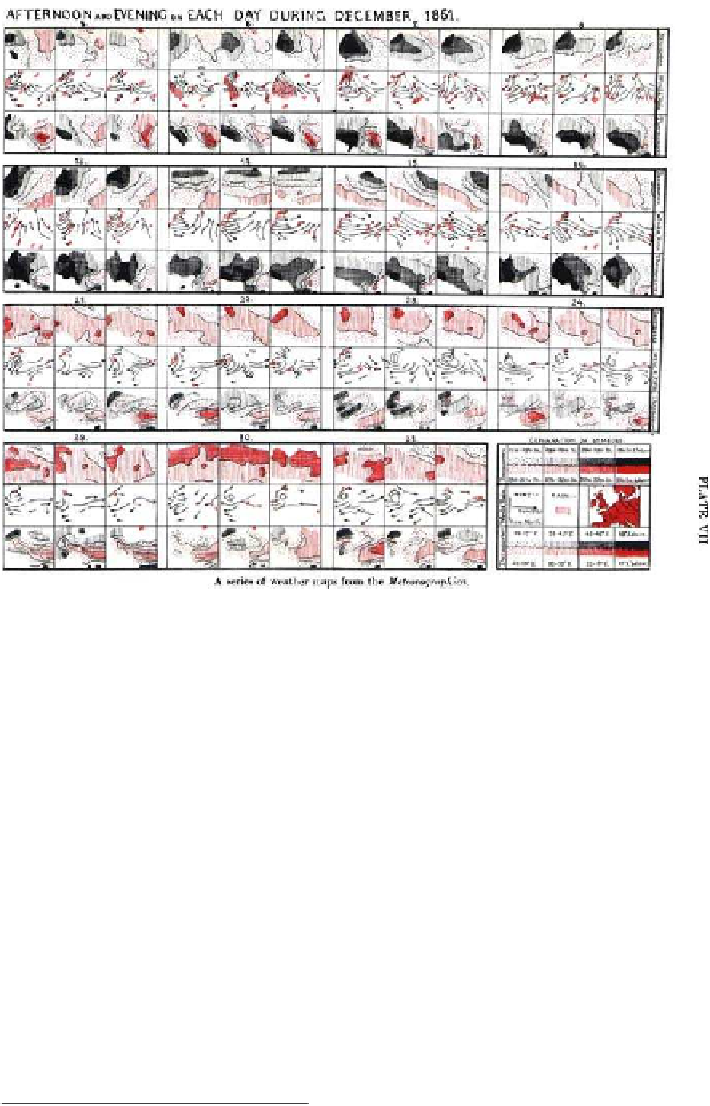
Figure
.
.
One page of Galton's
multivariate weather chart of Europe showing barometric
pressure, wind direction, rain and temperature for the month of December
. Source:Pearson
(
-
, pl.
)
spread in most of the countries of Europe from about
to
(Westergaard,
). Reports containing data graphics were published with some regularity in
France, Germany, Hungary and Finland, and with tabular displays in Sweden, Hol-
land, Italy and elsewhere. At the same time, there was an impetus to develop stan-
dardsforgraphical presentation attheInternational Statistical Congresses whichhad
begun in
in Belgium (organized by Quételet), and these congresses were closely
linked with state statistical bureaus. he main participants in the graphics section
included Georg von Mayr, Hermann Schwabe, Pierre Émile Levasseur and Émile
Cheysson. Amongother recommendations wasone fromthe
th Statistical Congress
in
that o
cial publications be accompanied by maps and diagrams. he state-
sponsored statistical atlases that ensued provide additional justification to call this
period the golden age of graphics, and some of its most impressive exemplars.
he pinnacle of this period of state-sponsored statistical albums is undoubtedly
the Albums de statistique graphique published annually by the French ministry of
public works from
to
under the direction of Émile Cheysson.
hey were
Cheysson had been one of the major participants in committees on the standardization of
graphical methods at the International Statistical Congresses from
on. He was trained