Graphics Reference
In-Depth Information
Cartesian Product of Model Parameters
6.5.2
Figure
.
displays all four models as a Cartesian product of model parameters. he
models in the columns of Fig.
.
are distinguished by the absence or presence of
a parameter for
Type
- forcing a common intercept in the let column and allowing
different intercepts by
Type
in the right column. he three rows are distinguished
byhowthe covariate
Calories
ishandled: separate slopesby
Type
inthe top row,
constant slope for all
Type
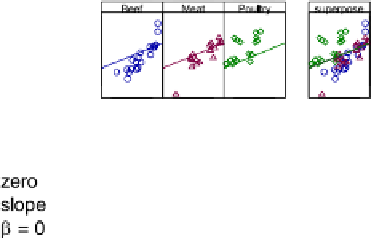
s in the middle row, or identically zero slope (horizontal
line) in the bottom row.
Figure
.
is structured as a set of small multiples, a term introduced by Tute
(
)to indicate repetition of the same graphical design structure. “Small multiples
are economical: once viewers understand the design of one slice, they have imme-
diate access to the data in all other slices. hus, as the eye moves from one slice to
the next, the constancy of the design allows the viewer to focus on changes in the
data rather than on changes in graphical design (Tute,
, p.
).” Figure
.
may
be interpreted as a four-way Cartesian product: slope (α vs. α
i
), intercept (β
,
β, β
j
), individual panels vs. superpose, hot dog type (beef, meat, poultry) with an
ordinary two-way scatterplot with a fitted line inside each element of the four-way
product.
=
Figure
.
.
Sets of ANCOVA plots as a Cartesian product of models with the intercept having two
levels (α and α
i
) and slope having three levels (
, β,andβ
j
). he middle plot on the right is identical to
the plot in Fig.
.
(Files: hh/regbb/code/hotdog.s, hh/csc/code/hotdog.csc.s)