Graphics Reference
In-Depth Information
Figure
.
.
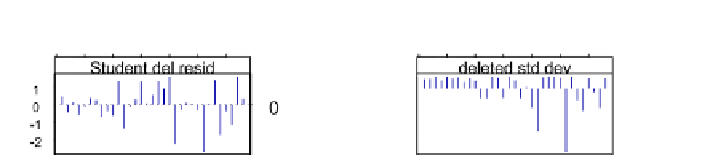
Regression diagnostics plot for Kidney data (File: hh/csc/code/kidney
.s)
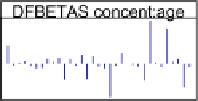
DFBETAS
flags indicate that cases
,
, and
appreciably impact one or more re-
gressioncoe
cientestimates.he
dffits
flagssuggestthatcases
,
,and
have
substantial effects on model predictions. In addition,
deleted std dev
hints
that cases
and
impactthe overall goodness of fit.Wedrawthe splom inFig.
.
toshowthesepoints identified. Weseethat fourofthefive flagged points areextreme
on at least one variable. Point
has low
clearance
,high
concent
,andhigh
age
. Point
has low
weight
.Points
and
have low
age
.Point
isharderto
interpret from just this graph as it has high
weight
, but not the highest
weight
.