Graphics Reference
In-Depth Information
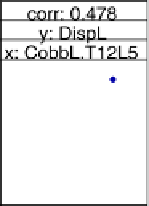
Example - an
xysplom
with Labeled Correlation Coeicients
6.3.6
Figure
.
is taken from a study Harrison et al. (
) of scoliosis, abnormal lat-
eral curvature of the spine. An initial stage of the study required associating each of
two response variables (
DispL
and
DispR
, measures of translation displacement)
with its own set of four potential explanatory variables. All explanatory variables are
angles between lines drawn through projected centers of mass on AP (front-back)
radiographsofthoracic andlumbarvertebrae.Variable namesincludingtheletter“L”
are measurements on the let side of the subject's body and the names including the
letter “R”are measurements on the right side of the body.he figureshows moderate
correlations between most of the pairs of variables.
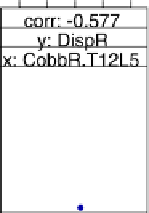
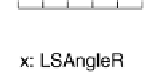
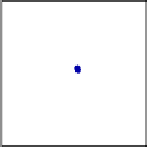
Figure
.
.
An xysplom of two response variables, each with four associated explanatory variables.
Pairwise correlations are shown in the strip labels. he separate y-scales for each response variable
were forced to show a common number of data units per inch of graph. Each pair of x-scales, for
Let and Right measurements of similar quantities, has a common scale. All four panels on the let,
those containing an x-variable name that includes the string “Cobb,” have the same scale (File:
h
/splm/code/scolio
.s)