Graphics Reference
In-Depth Information
Figure
.
.
Averaged shited histograms constructed from the data and bin width of Fig.
.
with
increasing numbers of averaged bin edges
with K
h
h. he estimate is the sum of a collection of n probability
masses, each with shape K and size n
−
, centered on the observations. Figure
.
demonstrates the construction of such an estimate for the percentage of silica in
chondritemeteorites(fromAhrens,
),withastandardnormalkernelandaband-
width of
.
(
t
)=
K
(
t
h
)
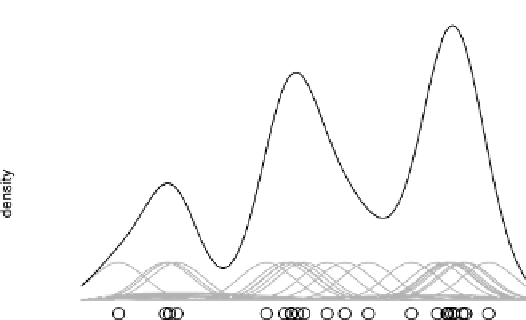
Figure
.
.
Example of kernel density estimate construction for percent silica in chondrite meteorites.
he original observations and individual kernel functions are displayed. he final estimate is the
vertical sum of all n=
kernel functions