Graphics Reference
In-Depth Information
Figure
.
.
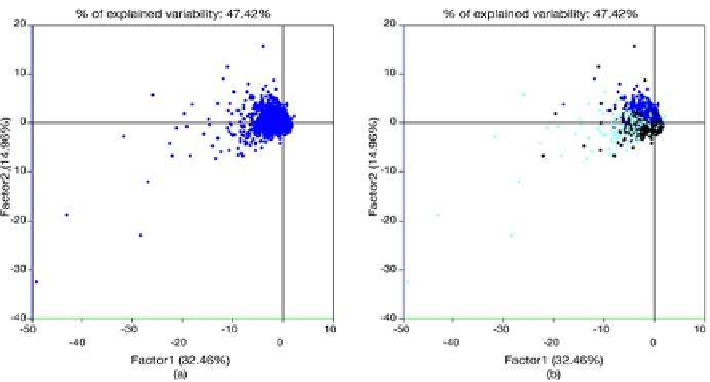
Statistical units on the first factorial plan (SHIW data). (
a
) Classical view. (
b
)Units
distinguished according to categories of Q variable
Some interesting patterns can also be revealed using a scatterplot matrix repre-
sentation obtained by representing the first factor with respect to the other ones, as
shown in Fig.
.
. he plot, as above, uses highlighting to explore the position of
employees (black points) in the different spaces.
Figure
.
showsthecontributionrepresentationfortheunits.Withrespecttothe
classical representation that uses dimensionless points, thesameunitsarerepresented
by pies proportional to their contribution. Notice that pies are characterized by two
colors (blue and green): green refers to the contribution to the first factor (horizontal
axis) and blue to the second one. Configuration of the points in the graphics is en-
hanced bymany usefulbitsof information fortheanalyst. Toinvestigate themasking
effect, on the right-hand side only the units with a contribution to the first plane of
up to
% are shown using the filtering capabilities of VITAMIN-S.
he exhibited pattern of the unit plot is typical in data-mining applications: an
overwhelming majority of points shows features similar to the average unit. his in-
volves a masking effect in revealing interesting variability. he next step is to make
these units supplementary. Removing units or variables is a simple and fast task with
VITAMIN-S: onesimply selects andcuts thepoints on the screen. Aremovalimplies
that factors are recalculated: this is immediately done in VITAMIN-S and displays
are updated in real time.heUNDO functionality allows the user to go forward and
backward in the different configurations. By evaluating changes in distances among
points and absolute contributions the user understands the relationships in the data.
Aterthedeletion,wetake alookatthevariable andunitconfiguration inFig.
.
.
From the variable representation it is evident that a remarkable change occurred: on
the first axis two variables move to the right side of the plane while the variables are
again split on the second factor.