Graphics Reference
In-Depth Information
Figure
.
.
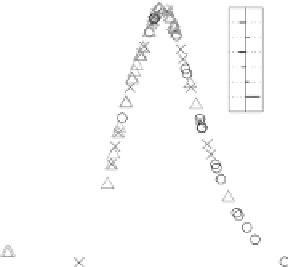
One-dimensional data projections corresponding to maxima from four different PP indices
computed on the same data. he interesting feature of the data is the separation of the three classes. Top
let: the holes index finds a projection with a hole in the middle, where one cluster is separated from the
other two. Top right: the central mass index finds a projection where most points are clumped in the
center, revealing a few outliers. Bottom let: LDA, using the class information, finds a separation of all
three clusters. Bottom right: the PCA index finds a projection where all three classes are somewhat
distinct
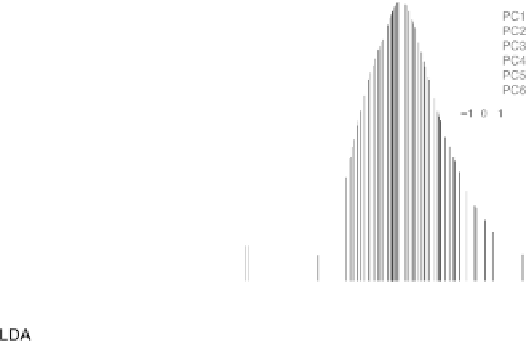
PC
is rotated out of the projection first (Fig.
.
, top right). Note that all the co-
e
cients change some because they are constrained by the orthonormality of the
p-dimensional data frame. But notice that the coe
cient for PC
is effectively re-
duced to zero. here is very little change to the projected data, so this variable might
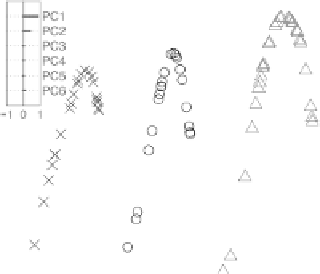
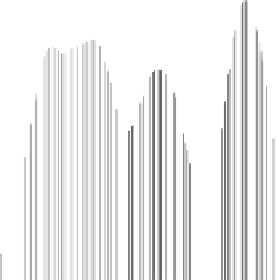
beignored.NextweexploretheimportanceofPC
byrotating itoutoftheprojection
(Fig.
.
,bottom row).Asmall change inthe coe
cient forPC
results ina blurring
of the gap between the two letmost clusters (bottom let plot). When PC
is com-
pletely removed (bottom right plot), the two letmost clusters are indistinguishable.