Graphics Reference
In-Depth Information
Figure
.
.
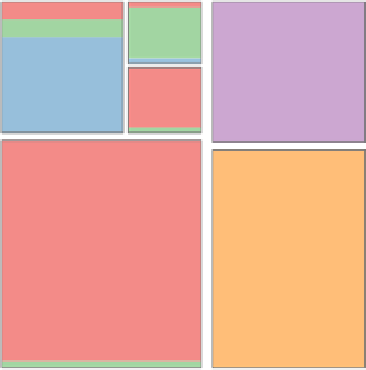
Treemap with stacked bars representing response classes. Color coding and data are the
same as in Fig.
.
It is helpful to adjust spaces between partitions to reflect the depth at which a given
partitioning took place, showing splits closer to the root with larger gaps.
Treemaps are useful for assesing the balance of a tree model.In very noisy scenar-
iostrees tendtoattemptsplitting offsmall,reasonably homogenoussubgroups,while
leaving a large chunk of cases in one node that is hard to separate. Such behavior is
easily detected in treemaps as large terminal nodes.
Moreover, treemaps are suitable for highlighting or brushing, allowing the com-
parison of groups within terminal nodes. A treemap of the model fromFig.
.
with
colors stacked by group is shown in Fig.
.
.
It is clearly visible that the tree model is able to split off large homogenous groups
successfully,butmoresubsequentsplittingisnecessaryfornodesvisibleintheupper-
let part of the plot.
Treemaps described here are an extension of those used in computer science in-
formation visualization of hierarchically storedcontents. heyarealso related to mo-
saicplots. More precisely a mosaicplot is a treemap of a decomposition tree, that is,
a tree whose splits of the same depth use the same categorical splitting variable and
have as many children as there are categories in the data.
he main advantage of treemaps is their very e
cient use of display space. hey
allow absolute comparison of nodes and subgroup sizes while maintaining context
ofthetreemodel.heyscalewellwithbothincreasingdatasetsizeandtreemodel
complexity. What they cannot show is information about splitting criteria, and they
do not allow direct relative comparison of groups within nodes. An alternative visu-
alization technique exists for the latter task.
Spineplots of Leaves
Another useful plot for tree model visualization is the spineplot of leaves (SPOL). By
not alternating the partitioning direction as in treemaps, but constantly using hori-
zontal partitioning, we obtain a plot showing all terminal nodes in one row.