Graphics Reference
In-Depth Information
Figure
.
.
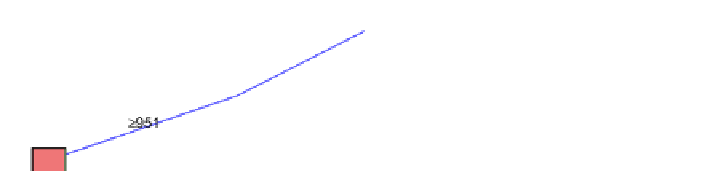
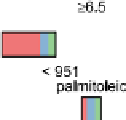
Censored zoom of nodes. Bottom plot:censoredzoom(
) of top plot.Nodesthatwould
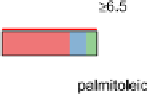
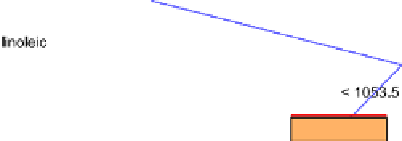
appear too large are censored at a maximum allowed size and flagged by a red line
plot and possibly other nodes. herefore we also enforce a maximal size of a node.
Again, to denote nodes that are not shown proportionally due to upper censoring,
weusearedlinealongthetopedgeofthenode.
heplacement of nodes isataskthathasbeendiscussedintenselyinthegraphvisu-
alization community. For small trees, simple approaches, such as a bottom-up space
partitioning,workwell.Asthetreesgrowlarger,nodelayoutbecomesmorechalleng-
ing. For tree model visualization, however, associated information is in most cases
more important than differences in local topology, especially where the structure is
imposed by the tree-growing algorithm. herefore interactive approaches, allowing
the user to explore the tree model by local magnification while retaining global con-
text, are recommended for large tree models.
Intheabove examples, basic lateral placement isperformedbyan equidistant par-
tition of the available space. Only the first plot uses nonequidistant placement of
nodes in the direction of tree depth, namely, the distance of two nodes in this di-