Graphics Reference
In-Depth Information
Figure
.
.
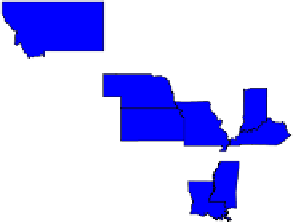
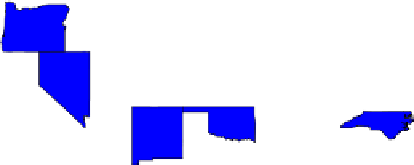
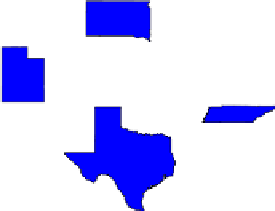
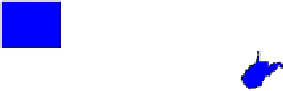
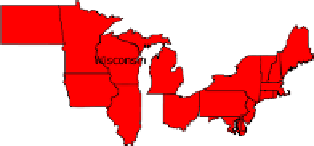
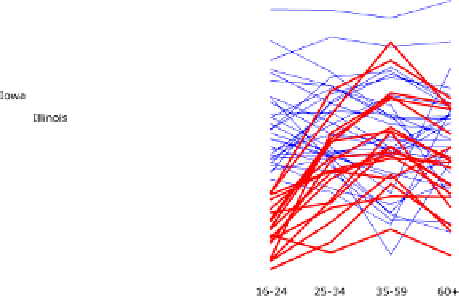
Map linking. Let: choropleth map of states of the United States, with the brightness
indicating degree of interest. Right: parallel coordinates view of four variables, each of which indicates
the percentage of people married at four different age categories. States where fewer people marry
young were selected for this view
which state is the one defined by the line at the top of the parallel coordinates plot,
having uniformly higher marriage rates than all other states at all age groups.
REGARD also pioneered view linking in networks, which was further developed
inNicheWorks(Wills,
).Herethedomain-specificdataconsistofinformationon
nodes and links of a graph, and the goal is to use the linking mechanism to facilitate
exploration of relationships between the two sets of data, as in Fig.
.
. A variation
on distance-based linking was used in this application, with distance being defined
in terms of data as the graph-theoretic distance between nodes. So selecting an in-
dividual node would give it a degree of interest of
, and then the degree of interest
would flow along the graph, so nodes n steps away might have degree of interest rn,
for some r<
.
A final and important domain that we will discuss is the domain of modeling re-
sults. In Sect.
.
, we noted that Data Desk incorporated text descriptions of models
within the linking paradigm. It is also useful todevelop model-specific views and in-
corporate them within a framework. Consider hierarchical clustering, for example.
Hierarchical clustering clusters data using similarities and has a natural tree repre-
sentation. Figure
.
shows a representation of such a model for the data of Fig.
.
,
namely, the marriage patterns of states.
In the hierarchical clustering view, a leaf node has a degree of interest of either
or
, depending on the selection propagated fromthe parallel coordinates view. Each
parent node created by the clustering algorithm is defined as containing all its chil-
drenandhasbeen displayed usingthe mean summarymethod,displayedasa bright-
ness scale between black (all data rowsin this clusterwere selected)and light gray (no
data rows in this cluster were selected). his continuous degree of interest allows the
clustering to be explored in the context of the original data, and, by selecting clusters
andshowingthelinkingintheparallelcoordinatesview,itallowsuserstounderstand
what those clusters represent.