Graphics Reference
In-Depth Information
Figure
.
.
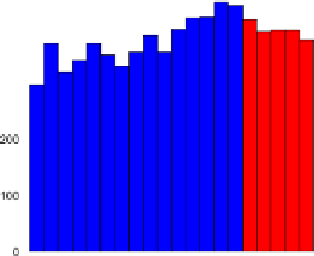
Simple linking between a barchart and a scatterplot. he let view is a histogram of the
number of players in baseball by year, and the right view is a scatterplot of players' salaries (on a log
scale) against their batting average. A quadratic curve has been imposed on the salary data to show level
differences between the selected and unselected groups; it is not intended to be a good fit to the data
foryears
through
.Inboththehistogramandthescatterplot,thoseselected
data elements are shown in black and the unselected ones in light gray.
he linking between the views is achieved by allowing the user to select part of
one view, in this example using a rectangular selection device,which has the effect of
selecting the graphic elements that intersect that rectangle. InFig.
.
above, the link-
ing shows us that there is a level effect for years on salaries, but there is no evidence
that it affects the basic relationship between batting average and salary.
A fundamental question for any visualization technique that should always be
asked is: “Why should I use this?” or “Why should I need to link views together -
what benefit do I get from this?” From the analyst's point of view, if the analyst has
created a view of the data and seen something of interest (or, as can also oten occur,
notseen something of interest whentheyexpectedto),then theywill want toexplore
further. hey will want to know, for example, if data form clusters under a particular
projection of the grand tour or if there is a change in the relationship between salary
and years playing baseball when the latter is above a given threshold? When they see
somethinginteresting,theywanttoexplainit,usuallybyconsideringotherdataviews
or by including additional variables. With some types of view, it is not hard to add in
variables and see if those variables can explain the feature, or indeed if they have any
effectwhatsoever.Inaregressionanalysis,youcanaddavariabletothesetofexplana-
tory variables (taking due care with respect tomulticollinearity and other confound-
ingfactors).Ifahistogramof X shows something of interest, you can “add”a variable
Y to it by making a scatterplot of X against Y. If you want to explain something in
a scatterplot, then it is possible to turn it into a rotating point cloud in
-D. Using
projection pursuit or grand tour techniques, you can go to still higher dimensions.