Graphics Reference
In-Depth Information
Figure
.
.
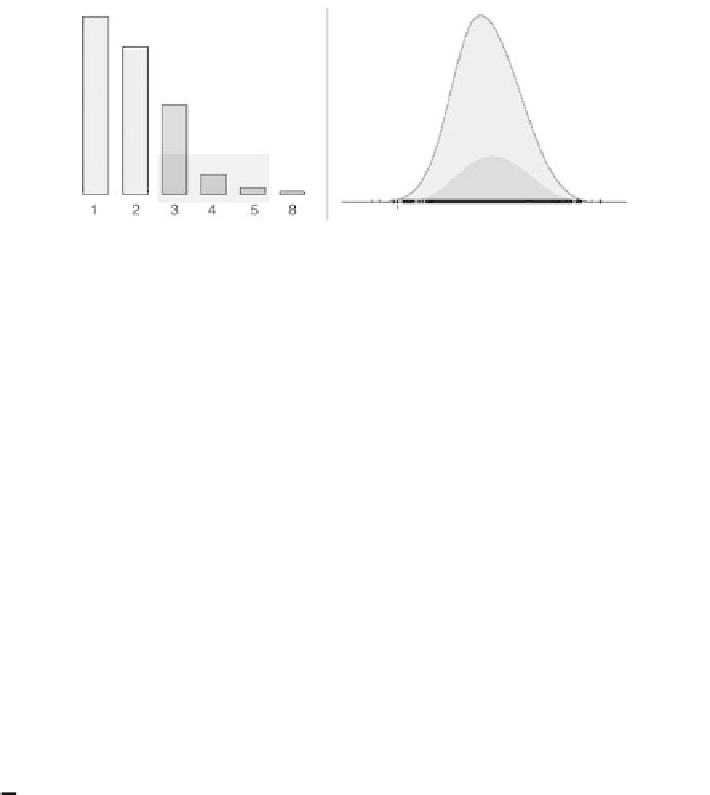
Does students reading behavior have an impact on their performance in mathematics? he
distribution for those students who read more than
h a day is shited toward the higher scores
subgroup. In Fig.
.
three categories are selected at the same time and the resulting
conditionaldistributionisdisplayedinthehistogram.hedatausedhereandinmost
other examples which follow are a subset of the hird International Mathematics and
Science Study, an international survey to assess the level of and possible influences
on the mathematics and science achievements of
- and
-year-old students. he
dataset used here consists of a German sample of
students. he dataset is rather
typical forsurveys in the social sciences andcontains afewcontinuous variables, like
the scores on the mathematics and science test, and a large number of categorical
variables originating from a questionnaire using a five-point Likert scale.
Another main advantage of linked views is the applicability tocomplex data struc-
tures. he linking concept comes quite naturally with geographically referenced data
byconnecting themeasurements with thegeographic location atwhichthemeasure-
ments were made. Figure
.
shows a map of Bavaria that indicates those counties
with a high percentage of forestry.
Anselin (
),Wills (
)and Roberts (
) provide a comprehensive discus-
sion of linking in spatial data exploration.
hemainapplicationfocusoflinkeddisplaysisinstatisticalexplorationofdatasets,
in particular, addressing issues such as
Investigating distributional characteristics,
Finding unusual or unexpected behavior, and
Detecting relationships, structure, and patterns.
Aparticularassetoflinkedviewscomeswithcategoricaldataandtheeasyavailability
of conditional views. Figure
.
shows the conditional distribution of the variable
reading for pleasure formalestudents.Sincethenumberofstudentsinthegroupof
students who read outside school is in inverse relation to the amount of time spent
reading, it is di
cult to see whether the males show a particular pattern.
By switching the barchart on the right to a spine plot (Hummel,
), we can see
theproportions ofmales falling into eachcategory ofreading habits. Hereitbecomes
immediately obviousthat malesareunderrepresentedinthemediumclass.Malestu-
he dataset used here is from the Bavarian O
ce of Statistics and includes information
about land usage for the
counties in Bavaria.