Graphics Reference
In-Depth Information
Figure
.
.
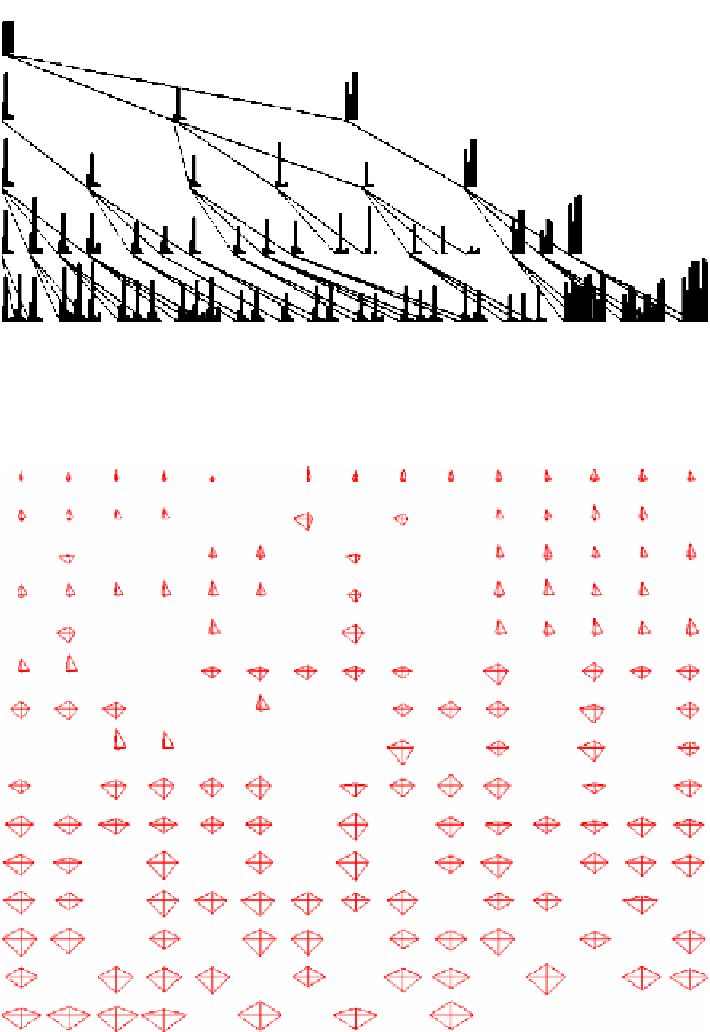
Profile glyphs of a hierarchically clustered subset of the Iris data. Nonterminal nodes are
computed as the average values of their descendents. he clustering algorithm appears to have done
a reasonable job, though a few outliers exist, such as the cluster associated with the fith node in the
third row
Figure
.
.
Star glyphs of Iris data set, ordered by one dimension and positioned with horizontal
spacing proportional to the distance between adjacent data points. his nonoverlapping layout makes it
easy to identify both clusters and large gaps in the N-D distance where the values for the ordering
dimension are similar to each other