Graphics Reference
In-Depth Information
Figure
.
.
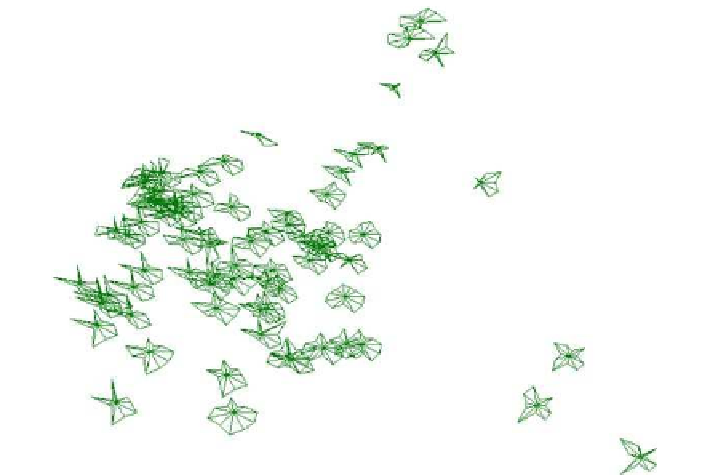
Example of positioning glyphs using derived dimensions. In this case, the breakfast cereal
data set is shown using the first two principal components to generate the positions. Again, groups of
similar shapes are clearly visible
relationship, where on top of the linear ordering is a cycle length, which implies that
each glyph is related not only to the adjacent glyphs in the sequence but also the
glyphs in the previous and following cycles. Examples of such cyclic placement are
shown in Fig.
.
.
Another type of structure that can be used for positioning is hierarchical or tree-
based structures (Ward and Kein,
). hese may be a fixed attribute of the data
(e.g., a computer file system) or computed via, say, a hierarchical clustering algo-
rithm. A wide range of options exist for computing the positions given such a hi-
erarchical structure, as can be seen in the tree-drawing literature (Di Battista et al.,
).Hierarchically structured glyphs allow easy access both to the raw data as well
as aggregation information (Fig.
.
). Finally, data records might have a network or
graph-based structure, such as geospatial data or the web pages associated with an
organization. Again, methods from the graph-drawing community can be used to
generate the positions for glyphs.
Differentstructure-driven placement strategies willhavedifferentdegreesofover-
lap; agrid layoutof ordereddata recordscan assurenooverlaps, whiletree and graph
layouts fordense data sets can resultin significant overlap.Incases of overlap,distor-
tionmethodsarequitecommon,asstructuremaybeeasilypreservedandvisibleeven
with significant movement of glyphs. Most nonlinear distortion (lens) techniques
(Leung and Apperley,
) allow the user to view one region of the data space in
greater detail than others, shiting the distribution of screen space to provide more