Graphics Reference
In-Depth Information
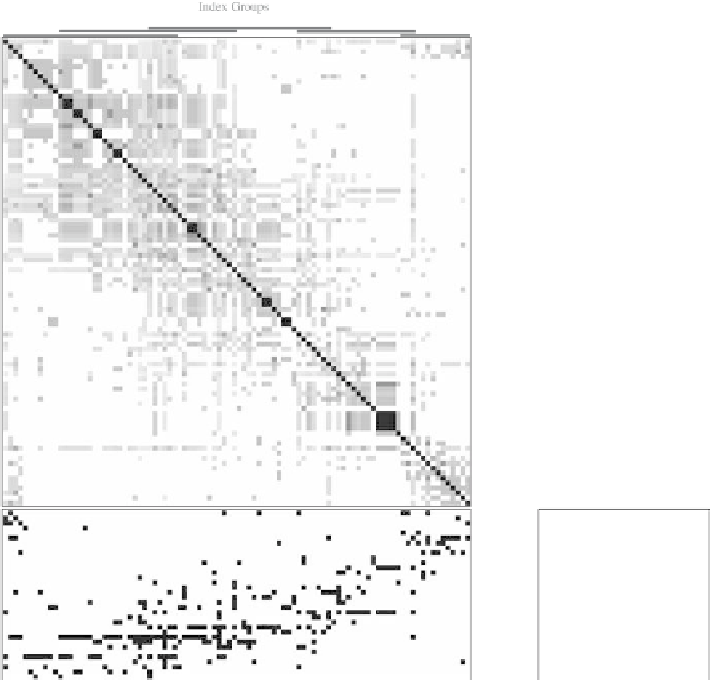
Figure
.
.
Matrix visualizations of the Handbook with chapters in the rows and index entries in the
columns
Lee Wilkinson approaches graph-theoretic visualizations from another point of
view,andhisdisplaysare concerned predominantly, thoughbynomeans exclusively,
withtrees, directedgraphsandgeometric graphs. Healsocoversthelayoutofgraphs,
atrickyproblemforlargenumbersofvertices, andraisestheintriguing issueofgraph
matching.
Most data displays concentrate on one or two dimensions. hisis frequently su
-
cient to reveal striking information about a dataset. To gain insight into multivariate
structure, higher-dimensional representations are required. Martin heus discusses
themainstatistical graphicsofthiskindthat donotinvolve dimension reductionand
compares their possible range of application.
Everyone knows about Chernoff faces, though not many ever use them. he po-
tential of data glyphs for representing cases in informative and productive ways has
not been fully realized. Matt Ward gives an overview of the wide variety of possible
forms and of the different ways they can be utilized.