Graphics Reference
In-Depth Information
Figure
.
.
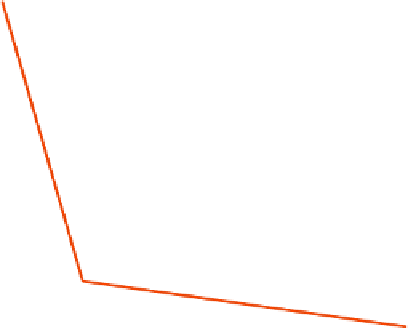
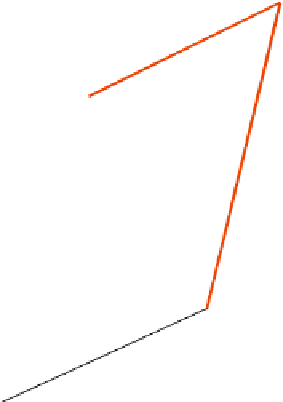
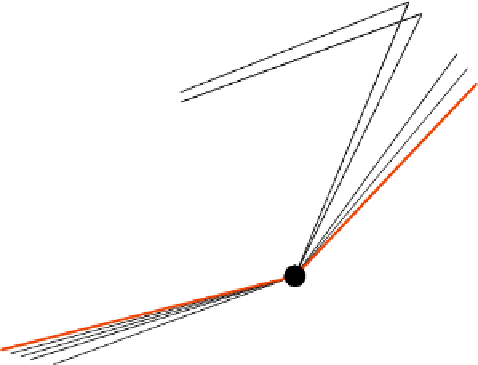
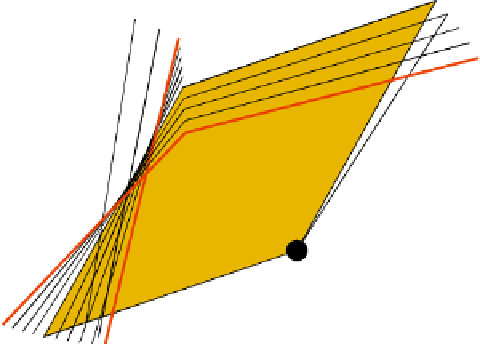
Example path of a grand tour
he planes between the randomly selected base planes are interpolated to get
a smooth pseudorotation, which is comparable to a physical
-D rotation. A more
technical description of the grand tour can be found in Buja et al. (
). Although
the human eye is not very well trained to recognize rotations in more than three di-
mensions, the grand tourhelps reveal structures like groups,gaps, and dependencies
in high-dimensional data, which might be hard to find along the orthogonal projec-
tions.
Although projections areusually monitored using ascatterplot, any other plotlike
a histogram or parallel coordinate plot can be used todisplay the projected data (see,
e.g., Wegman,
).
Projection pursuit is a means to get more guidance during the rotation process.
A new projection plane is selected by optimizing a projection pursuit index, which
measures a feature like point mass, holes, gaps, or other target structures in the data.
Grand Tour vs. Parallel Coordinate Plots
6.5.1
he grand tour is a highly exploratory tool, even more so than the other methods
discussed in this chapter. Whereas in classical parallel coordinate plots the data are
still projected to orthogonal axes, the grand tour permits one to look at arbitrary
nonorthogonal projections of the data, which can reveal features invisible in orthog-
onal projections. Figure
.
shows an example of three projections of the cars data
set using the grand tour inside ggobi (see Swayne et al.,
).he cases are colored
according to the number of cylinders. Each plot has the projection directions of the
variables added at the lower let of the plot. Obviously these static screenshots of