Graphics Reference
In-Depth Information
in the data. Whereas the fact of a planned caesarean reduces the infection risk by
around half,we donot have asingle infection case forunplanned caesareans without
risk factors and antibiotics - although at least three would be expected. Note that
the chosen order is crucial for seeing this feature most easily. All these results can be
investigated by looking at Fig.
.
but are harder to find by using classical models -
nonetheless, they should be used to check significance.
Models
6.2.3
Meyer et al. (
, Chapter III.
same volume) presents a method for displaying
association models in mosaicplots. One alternative to looking at log-linear models
with mosaicplots is to plot the expected values instead of the observed values. his
also permits the plotting of information for empty cells, which are invisible in the
raw data but do exist in the modeled data. In general, a mosaicplot can visualize any
continuous variable for crossings of categorical data, be it counts, expected values of
a model, or any other positive value. Figure
.
shows the data from Fig.
.
with the
twointeractionsWater Sotness and Temperature and M-userandPreferenceincluded.
Remaining residuals are coded in red (negative) and blue (positive). he feature we
easily found in Fig.
.
- an increasing interaction between M-user and Preference -
would call for a four-wayinteraction or at least some nonhierarchical model.Neither
model can be interpreted easily or communicated to nonstatisticians. Furthermore,
thelog-linear modelincludingthetwo two-wayinteractions hasa p-value fargreater
than
.
, suggesting that the model captures all “significant” structure. A more de-
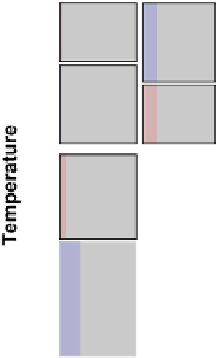
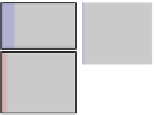
Figure
.
.
A model of the Detergent data with the interactions of Water Sotness and Temperature and
M-user and Preference included. he residuals are highlighted in red (darker shade)andblue (lighter
shade). A very faded color indicates a high p-value