Graphics Reference
In-Depth Information
Figure
.
.
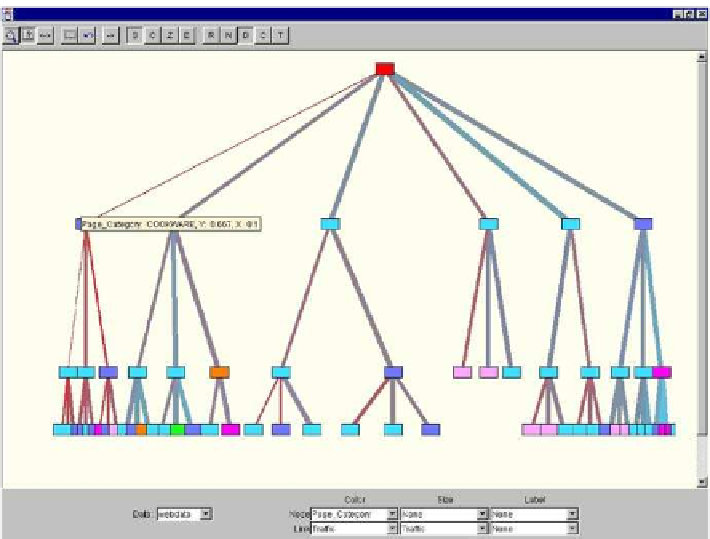
Layout of a website tree
data consist of FBI-reportedmurderrates forUS states in
.Asingle linkage clus-
ter analysis with leaves ordered by murder rates produced the tree.
hisisan interesting example forseveral reasons. First,weordinarily donotthink
ofclusteringasetofobjectsonasinglevariable.Clusteringinonedimensionisequiv-
alent to mode hunting or bump hunting, however. Hierarchical clustering (as in this
example) can yield a
-D partitioning into relatively homogeneous blocks. We are
seeking intervals in which observations are especially dense. We see, for example,
that there are clusters of southern and midwestern states whose murder rates are
relatively similar. he mode tree (Minnotte and Scott
) is another instance of
a tree representation of a
-D dataset. his tree plots the location of modes in the
smoothed nonparametric density estimator as a function of kernel width. Second,
a topological sort on a total order is the same as an ordinary sort. hat is, by sorting
the leaves of this tree on murder values, we have produced a topological sort. For
hierarchical clustering trees on more variables there exist more than one topological
sort to help organize a tree for viewing. Wilkinson (
) discusses some of these
strategies.
Hierarchical trees with many leaves can become unwieldy in rectangular layouts.
In Fig.
.
we lay out the same cluster tree in polar coordinates. Other types of cir-
cular layouts (e.g. Lamping et al.
) can accommodate even larger trees. Circular
layouts are popular in biological applications involving many variables because of
their space-saving characteristics. It is best, of course, if the polar orientation has an