Graphics Reference
In-Depth Information
Figure
.
.
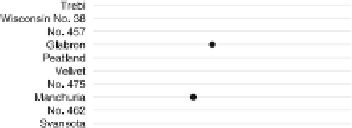
Example of a complex Trellis plot. he data are yields of several different varieties of barley
at six sites, over
years. he plot consists of
panels, one for each year at each site. Each panel consists
of a dotplot showing yield for a particular site in a particular year and a strip showing the year and the
name of the site