Graphics Reference
In-Depth Information
Figure
.
.
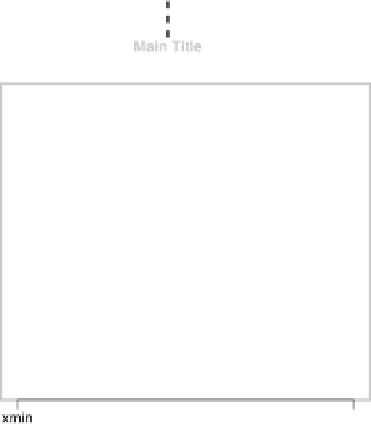
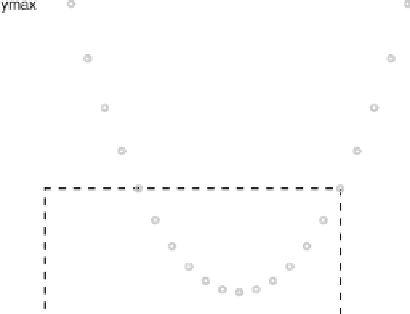
Two of the coordinate systems involved in producing a simple scatterplot. A 'normalized'
coordinate system that covers the whole page is used to centre the plot title, and a coordinate system
based on the range of the data that covers the plot region is used to position the data symbols
Many users of statistical graphics sotware produce a plot and then export it to a for-
mat which can be easily edited using third-party sotware (e.g. export to WMF and
edit using Microsot O
ce products). his has the disadvantage that the coordinate
systems used to produce the plot are lost and cannot be used to locate or size an-
notations. Furthermore, it makes it much harder to automate or programmatically
control the annotation, which is essential if a large number of plots are being pro-
duced.
When it comes to annotating a plot, it is important that output can be added rela-
tivetothecoordinatesystemswhichwereusedtodrawtheoriginalplot.Forexample,
in Fig.
.
all additional output is positioned relative to the scales on the plot axes.
Because there are several coordinate systems used in the construction of a graph,
there must be some way to specify which coordinate system to use when adding fur-
ther output.
In R's traditional graphics, each function for adding additional output to a plot
only works with asingle coordinate system. For example, the
text()
function only
positions text relative tothe scales on the axes and the
mtext()
function only posi-
tions textrelative tothe plotmargins (wherethe axis labels andplottitles are drawn).
R's grid package (Murrell,
) provides a more general approach; it is described in
more detail in Sect.
.
.