Chemistry Reference
In-Depth Information
6.2 Experimental Techniques
Our model squirmer consists of an aqueous droplet moving in an oil 'background'
phase. The aqueous phase includes a source of bromine either in the form of dilute
(25-50 mM) bromine water or a modified mixture of the Belousov-Zhabotinsky (B-
Z) reaction mixture. The non-oscillating B-Z reaction mixture consists of two parts:
(i) 50mMsulphuric acid (H
2
SO
4
) and 28mMsodiumbromate (NaBrO
3
) (ii) 400mM
malonic acid (C
3
H
4
O
4
) and 2.7mM ferroin (C
36
H
24
FeN
6
O
4
S). For the experiments
with the B-Z oscillations, the concentrations are modified as follows: (i) 500mM
sulphuric acid (H
2
SO
4
) and 280mMsodiumbromate (NaBrO
3
) (ii) 500mMmalonic
acid (C
3
H
4
O
4
) and 3mM ferroin (C
36
H
24
FeN
6
O
4
S). The two parts are mixed just
prior to droplet formation.Mono-olein (
rac
-Glycerol-1-Mono-oleate, SigmaAldrich)
is used as a surfactant, at concentrations (12.5-500mM), which are much higher
than its critical micellar concentration (CMC,
1m
M
) in the oil phase, which is
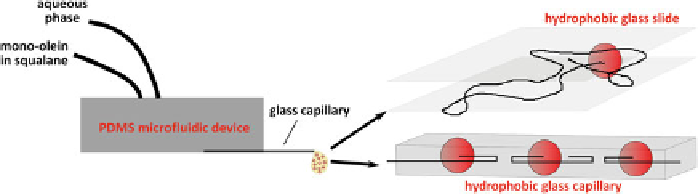
squalane (SigmaAldrich). Droplets of the aqueous phase are produced either by hand
or using a microfluidic device as shown in Fig.
6.2
and let into a hydrophobised glass
capillary or sandwiched between two hydrophobic glass slides separated by a PDMS
spacer of
<
m thickness. Microfluidic devices are produced using standard
soft lithography techniques using PDMS. The glass slides (capillaries) are cleaned
using isopropyl alcohol, dried and plasma cleaned for 90 s. A drop of commercially
available Nano-Protect is then used to coat the glass surfaces which are then heated
in an oven at 65
◦
for 30min to render them hydrophobic.
Droplet motion is recorded by a CCD camera (PCO 1200) or a high speed camera
(Phantom Miro, Vision Research) at frames rates between 0.5 and 1000Hz. Trajec-
tories are obtained by tracking the droplet positions using MATLAB (MathWorks)
and Image-Pro Plus (MediaCybernetics). The flow fields around the squirmer are
recorded using the technique of Micro Particle Image Velocimetry (
∼
100
µ
PIV) [
25
].
Briefly, the oil phase is seeded with fluorescent tracer beads (200nm green fluores-
cent polystyrene beads, Duke Scientific). Fluorescence microscopy is used to record
images of the tracer particles and the images are used for PIV analysis using an open
source code, PIVlab [
26
].
μ
Fig. 6.2
Left
microfluidic production of squirmer droplets. The droplet production is by a step
emulsification droplet production unit.
Right
the squirmers are observed in quasi one and two
dimensional environments by confining glass slides or capillaries. The
black lines
represent the
tracks of the swimmers