Chemistry Reference
In-Depth Information
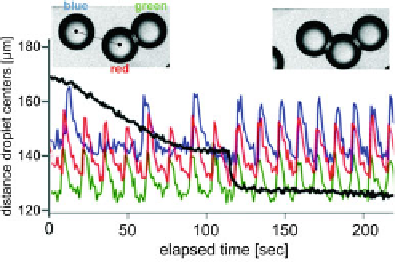
Fig. 5.8
Effect of membrane formation upon the phase coupling of chemical oscillators. The
blue
,
red
,and
green
trace represent the transmittance of the three droplets shown in the
insets
as a
function of time. The
black curve
shows, on the same time axis, the distance of the '
blue
'fromthe
'
red
' droplet (measured center-to-center). Clearly, the oscillations couple in phase as soon as the
membrane is formed (jump in the
black curve
), but not before
red arrow points to a droplet/droplet contact which in the top row has not yet formed
a membrane, but in the bottom row it has. A close inspection shows that in the top
row, the wave travels around the point of the red arrow. In the bottom row, however,
it passes this contact without noticeable hesitation.
In order to demonstrate the change in oscillator dynamics before and after cou-
pling, we observed the oscillation behavior of BZ droplets while theywere diffusively
moving relative to each other, finally forming bilayer membranes. Figure
5.8
shows
the transmittance traces of three droplets, exhibiting the spike pattern characteristic
of the BZ oscillation. The auto-catalytic reaction step which reduces the strongly
absorbing Fe
III
to the almost clear Fe
II
solute leads to a steep increase of the trans-
mittance. This is followed by a smooth decrease due to the gradual re-oxidation of
the Fe
II
involving the malonic acid. Initially, only the two droplets whose transmit-
tance traces are shown in red and green are connected by a bilayer membrane. This
was known from the direct observation of the membrane forming process. The third
droplet, the transmittance trace of which is shown in blue, had some distance to
the first pair, with about 50
surface separation from the 'red' droplet. A large oil
volume fraction was used in this sample, such that the droplets could diffuse freely
for some distance. Clearly, the red and green transmittance traces are phase locked,
while the blue trace follows its own pace, showing no sign of influence from the other
two for the first
µ
100 s shown. The black curve represents the distance of the centers
of the 'red' and 'blue' droplets, as determined from fitting circles to their images.
It shows how the 'blue' droplet gradually drifts towards the 'red'. At around 100 s,
the surfaces of the droplets have come so close that the drift is stopped due to the
diverging hydrodynamic resistance of the flat sphere-to-sphere contact. At about 113
s, the droplet centers are rapidly pulled together, which we interpret as the formation
≈