Chemistry Reference
In-Depth Information
The oil is squalane, with the lipid mono-olein as the surfactant at a concentra-
tion of 25mM, which is well above the critical micelle concentration (CMC). The
droplets in the upper row contained a fluorescent dye (di-4-ANEPPS, Invitrogen)
which preferentially enters the central lipophilic zone of a lipid bilayer. In Fig.
2.5
a,
which was taken immediately after the formation of the droplets, bright lines of flu-
orescence are visible in the oil layers extending between the droplets of the upper
row. Fig.
2.5
b is taken a few seconds later. Clearly, some of the bright lines have
disappeared, indicating the expulsion of the majority of the oil from between the
droplets. The transition from the bright line to this faint glow occurs abruptly, and
for each oil layer independently. It suggests itself to interpret this transition as the
formation of a lipid bilayer separating adjacent aqueous droplets.
That this is indeed the case is shown in Fig.
2.6
. For this experiment, two droplets
were used which contained 150mM/l NaCl in Millipore water, a content similar
to those in Fig.
2.5
except for the dye. These were gradually approached, in an oil
phase consisting of 25mM/l mono-olein in squalane, beyond the formation of a
contact between their interfaces, such that the latter formed a flat region separating
the droplets. After a few seconds, the same abrupt transition was observed as reported
in Fig.
2.5
. This time the droplets were connected via electrodes to a patch-clamp
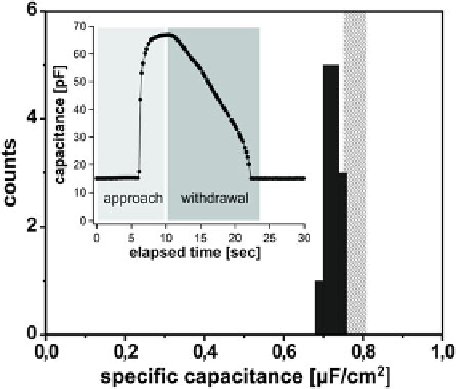
amplifier, such that the capacitance could be continuously measured. The inset in
Fig.
2.6
shows a trace of the sample capacitance for contact formation and subsequent
withdrawal. Frommicroscopic inspection of the flattened region of the interface, one
can estimate the diameter of that region, and thereby its area. This allows to calculate
the specific capacitance of the membrane thus formed. The histogram displayed
in the main panel summarizes a series of experiments performed with the same
pair of droplets. Clearly, the specific capacitance is well reproducible. The hatched
region indicates estimates for a solvent-free membrane of mono-olein, and compares
favorably with our results. The slight deviation may be either due to systematic errors
in the estimation of the area, or to some residual oil trapped in the membrane formed.
Fig. 2.6
Measurements of
the specific capacitance of a
bilayer membrane of mono-
olein in squalane. The
black
histogram represents the
measured values. The
grey
bar indicates the literature
values for oil-free mono-
olein membranes.
Inset
trace
of capacitance measurement
upon approach andwithdrawal
of two droplet surface to/from
each other