Chemistry Reference
In-Depth Information
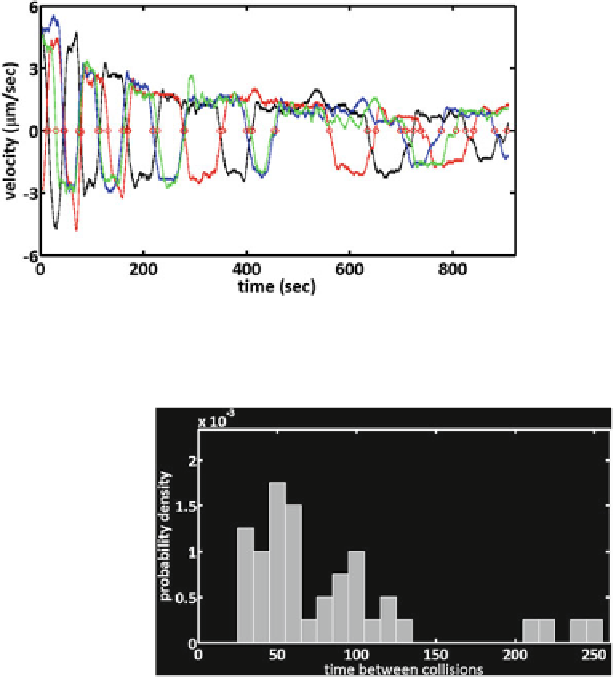
Fig. 7.12
Velocity of droplets in a channel as a function of time, shown for 4 representative droplets.
The traces are
coloured
for distinguishability. The
red circles
mark the zero crossings of the velocity
traces, indicating droplet collisions
Fig. 7.13
Probability density
of the time between the droplet
collisions
due to the gradually reducing speed of the droplets due to which collision times take
longer.
As discussed earlier, in order to account for the gradually decreasing velocity of
the droplets, we use a rescaled time variable
, given by Eq.
7.2
. In the frame of the
rescaled time, the velocity of the droplets remains constant at all times as seen in
Fig.
7.14
with a mean velocity of the droplets of
τ
|
| ∼
.
μ
m/s. Further, when
we now look at the distribution of the droplet collision times, we get a single peak
corresponding to
v
4
17
65 s as seen in Fig.
7.15
. In this case, we find the mean time of
the first collision to be 88.4 s.
Figure
7.16
shows the mean square displacement (MSD)
τ
∼
x
2
(τ
−
τ )
, where
τ
is the rescaled time step as defined in Eq. (
7.2
), plotted against the time step.
As expected, at the short times, we see a purely ballistic regime, characterised by
a MSD that grows as
t
2
. It can be seen that at a time of
80 s, there is a crossover
from the ballistic behaviour to a diffusive behaviour, where the MSD grows linearly
with time. The velocity autocorrelation for the droplets, is shown in red, and at the
short times the velocity is correlated due to the ballistic motion. However at the
∼