Chemistry Reference
In-Depth Information
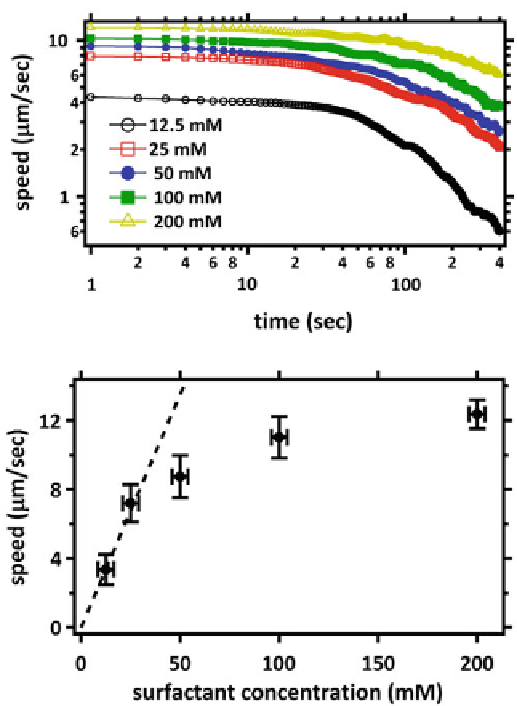
Fig. 6.7
To p
swimmer speed as a function of time, at different surfactant concentrations, where
each curve is an average of
∼
∼
μ
and
Bottom
the initial swimmer speed (average of first 40 time points) as a function of surfactant concentration
50 different squirmer droplets each of diameter
80
Fig.
6.7
shows the droplet speed as a function of time and one indeed sees the decay
of the velocity over time. However, to discuss the dependence of the initial droplet
speed as a function of the mono-olein concentration in the oil phase, we take an
average of the speed over the first 40 time points and this is shown in the bottom
panel of Fig.
6.7
. The initial linear increase is in agreement with the above prediction
(dashed line). As the surfactant density is further increased (and thus the velocity),
the complex exchange processes between the water/oil interface and the micelles
will finally become the rate limiting step. As a consequence, the speed is expected
to level off, in agreement with our data.
As mentioned before, the droplets come to a halt due to the consumption of fuel,
either the bromine within the droplet or the surfactant outside the droplet, whichever
runs out first. Since the control of bromine within the droplet is tricky due to nonlinear