Chemistry Reference
In-Depth Information
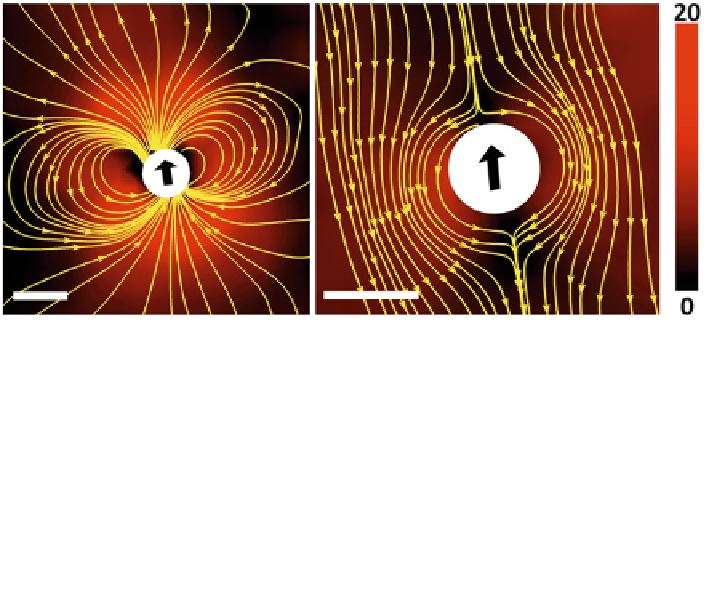
Fig. 6.5
Velocity field around a droplet squirmer. The flow velocity and streamlines in
Left
the
reference frame of the laboratory and
Right
the co-moving frame of reference. The magnitude of
the flow velocity (
color code
) and streamlines are along a horizontal section through the center of
a squirmer droplet. Scale bar: 100
μ
; velocity scale (
right
) in microns per second
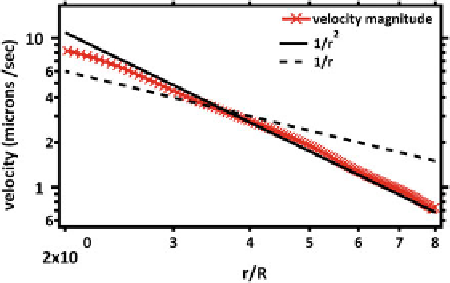
Fig. 6.6
The fluid velocity
calculated at the equator of the
swimming droplet. It shows a
decay of
r
2
as the distance
from the droplet increases
∼
1
/
it indeed resembles the flow field around that of a neutral squirmer as shown in
the bottom panel of Fig.
6.4
. Therefore, we can say here, as discussed in the linear
stability analysis, that the surface velocity indeed is set by the destabilisation of the
first mode of the spherical harmonics.
From the flow field calculated by
µ
PIV, we extract the velocity field in the oil
phase due to the droplet motion along the equator of the droplet. In Fig.
6.6
,the
velocity magnitude is plotted against the increasing distance from the center of the
droplet, where R is the radius of the droplet. It can be seen that the velocity decays
as
r
2
in the far-field. This is to be expected as we have discussed earlier since
the droplet is confined to a quasi two-dimensional space in which the measurements
are made. However, deviations from the
∼
1
/
r
2
behavior in the near-field, defined
∼
1
/
by r
3R, are observed. While these could be due to short lived variations in the
surface velocity and spatial inhomogeneties in the channel, further experiments are
needed to resolve these.
<