Graphics Reference
In-Depth Information
twoway scatter propval100 rent700 ownhome,
ylabel(0(10)100)
yscale(alt)
Stata gives you a number of options
that you can use to control the axis
scale for both the
-axes. For
example, here we use
yscale(alt)
to
move the
x
-and
y
-axis to its alternate
position, moving it from the left to the
right. See
Options : Axis scales
(265) for
more details about the options for
controlling the axis scales.
Uses allstates.dta & scheme vg outm
y
40
50
60
70
80
% who own home
% homes cost $100K+
% rents $700+/mo
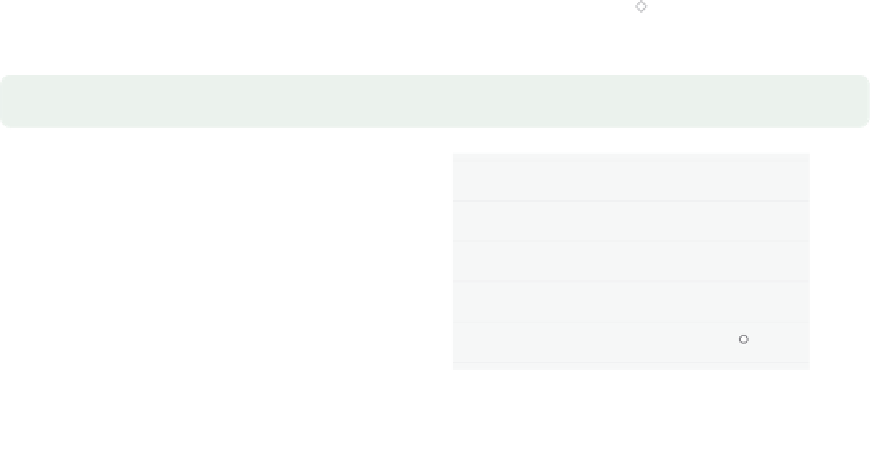
twoway (scatter propval100 ownhome)
(scatter rent700 ownhome,
yaxis(2)
)
In this example, we show
propval100
by
ownhome
and also
rent700
by
ownhome
, but for this second plot, we
put the
y
-axis on the second
y
-axis with
the
yaxis(2)
option. See
Options : Axis selection
(269) for more
information about using and controlling
additional axes.
Uses allstates.dta & scheme vg outm
40
50
60
70
80
% who own home...
% homes cost $100K+
% rents $700+/mo
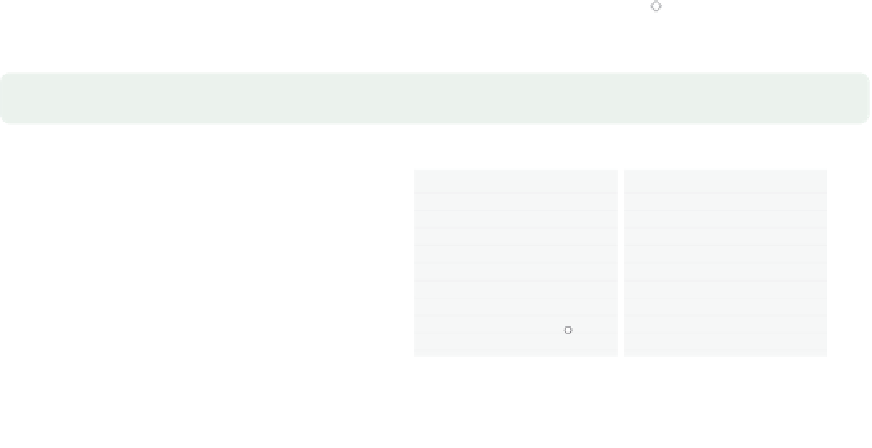
twoway scatter propval100 rent700 ownhome,
ylabel(0(10)100) yscale(alt)
by(north)
The
by()
option allows you to see a
graph broken down by one or more
by()
variables. Here, we show the
graph from above further broken down
by whether the state was part of the
North, making two graphs that are
combined together into a single graph.
The section
Options : By
(272) shows
more details and examples about the
use of the
by()
option.
Uses allstates.dta & scheme vg outm
S & W
North
50
60
70
80
50
60
70
80
% who own home
% homes cost $100K+
% rents $700+/mo
Graphs by Region North or Not
The electronic form of this topic is solely for direct use at UCLA and only by faculty, students, and staff of UCLA.