Graphics Reference
In-Depth Information
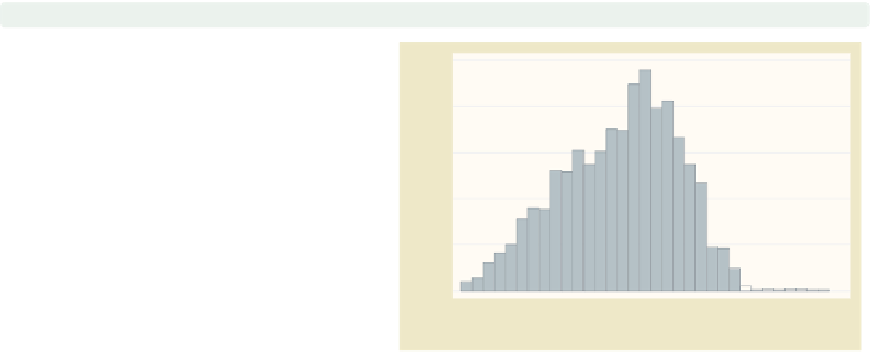
twoway histogram ttl exp
We begin by showing a histogram of
the variable total work experience.
Note that, unlike many other twoway
plots, this command takes only one
variable that is graphed on the
x
-axis.
The
-axis represents the density, such
that the sum of the areas of the bars
equals 1. If you are not going to
combine this graph with other twoway
graphs, the
histogram
command may
be preferable to
twoway histogram
.
Uses nlsw.dta & scheme vg past
y
0
10
20
30
Tot. work exper.
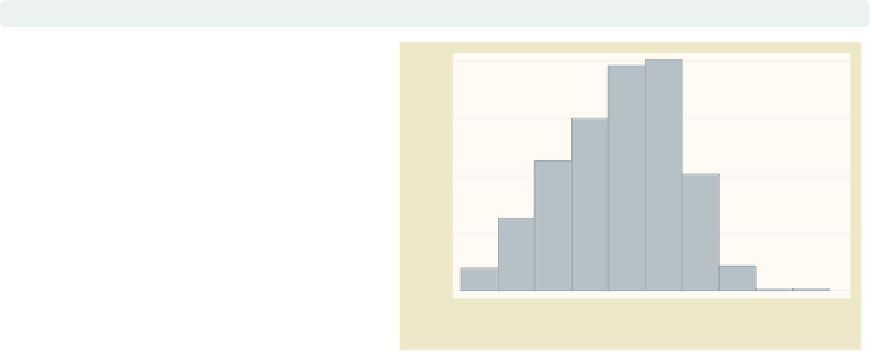
twoway histogram ttl exp,
bin(10)
We can control the number of bins that
are used to display the histogram using
the
bin()
option. Here, we request
that 10 bins be used.
Uses nlsw.dta & scheme vg past
0
10
20
30
Tot. work exper.
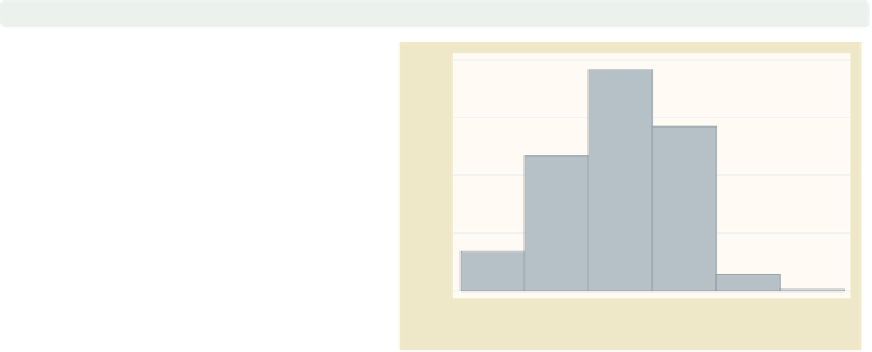
twoway histogram ttl exp,
width(5)
We can control the width of each bar
using the
width()
option. Here, we
make each bar 5 units wide. As you
might imagine, you can use either the
bin()
option or the
width()
option
but not both.
Uses nlsw.dta & scheme vg past
0
10
20
30
Tot. work exper.
The electronic form of this topic is solely for direct use at UCLA and only by faculty, students, and staff of UCLA.