Graphics Reference
In-Depth Information
2.5
Area plots
This section illustrates the use of area graphs using
twoway area
. These graphs are
similar to
twoway line
graphs, except that the area under the line is shaded. As a result,
many of the options that you would use with
twoway line
are applicable; see
Twoway : Line
(54) for more details. For even more details, see [
G
]
graph twoway area
. We will use
the
spjanfeb2001
data file, which has the prices for the S&P 500 index for January and
February 2001.
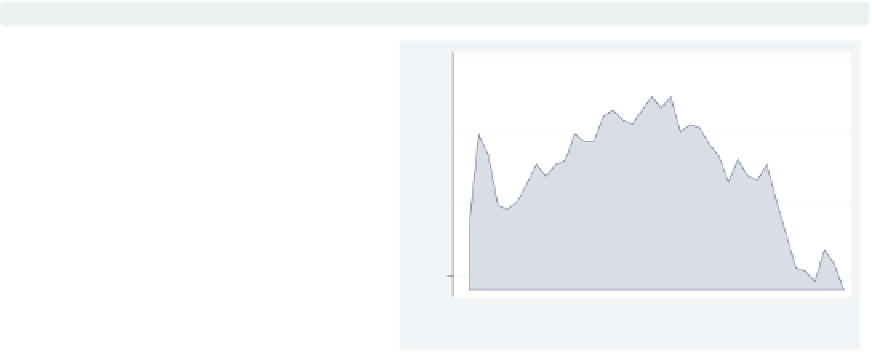
twoway area close tradeday,
sort
This is an example of a
twoway area
graph. Because this graph is composed
of connected points, the
sort
option is
recommended in case the data are not
already sorted by
tradeday
. If the data
are not sorted, and the
sort
option is
not specified, then the points are
connected in the order they appear in
the data file and will generally not be
the graph you desire.
Uses spjanfeb2001.dta & scheme
vg palec
0
10
20
30
40
Trading day number
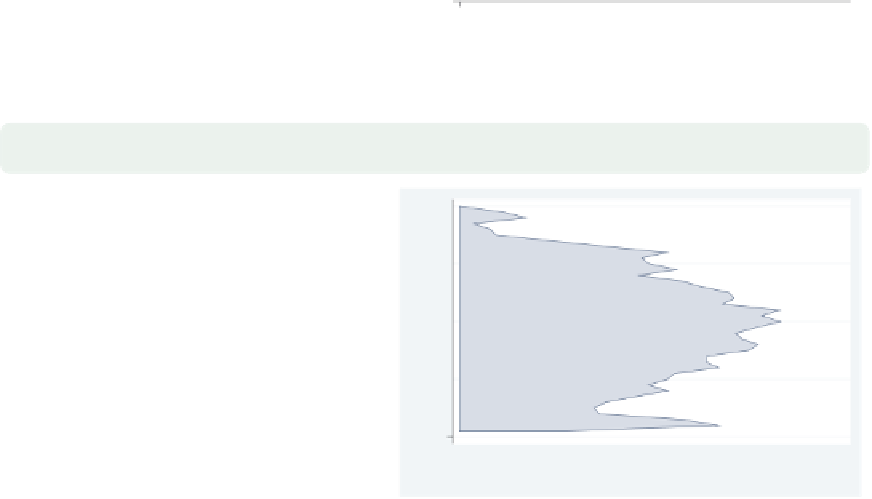
twoway area close tradeday,
horizontal
sort
xtitle(Title for x-axis) ytitle(Title for y-axis)
The
horizontal
option swaps the
position of the
close
and
tradeday
variables. Note that the
x
-axis remains
at the bottom and the
y
-axis remains
at the left.
Uses spjanfeb2001.dta & scheme
vg palec
1250
1300
1350
1400
Title for x−axis
The electronic form of this topic is solely for direct use at UCLA and only by faculty, students, and staff of UCLA.