Graphics Reference
In-Depth Information
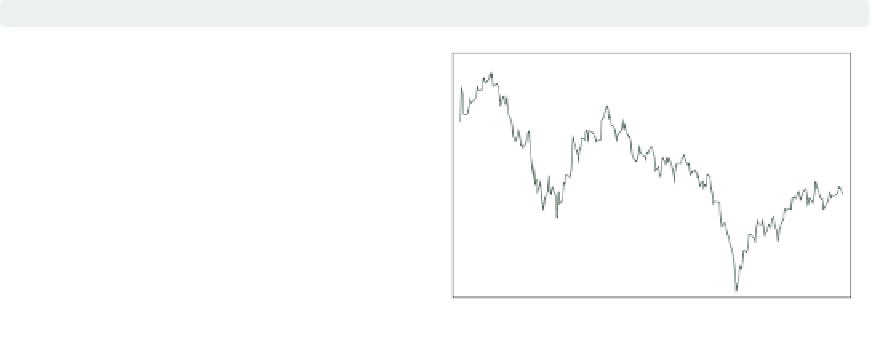
twoway tsline close,
ttitle(Day of Year)
We can use the
ttitle()
(time title)
option to give a title to the time
variable. We specify this as a
ttitle()
instead of
xtitle()
since this refers to
the axis with the time variable.
Uses sp2001ts.dta & scheme vg s1c
1Jan01
1Apr01
1Jul01
1Oct01
1Jan02
Day of Year
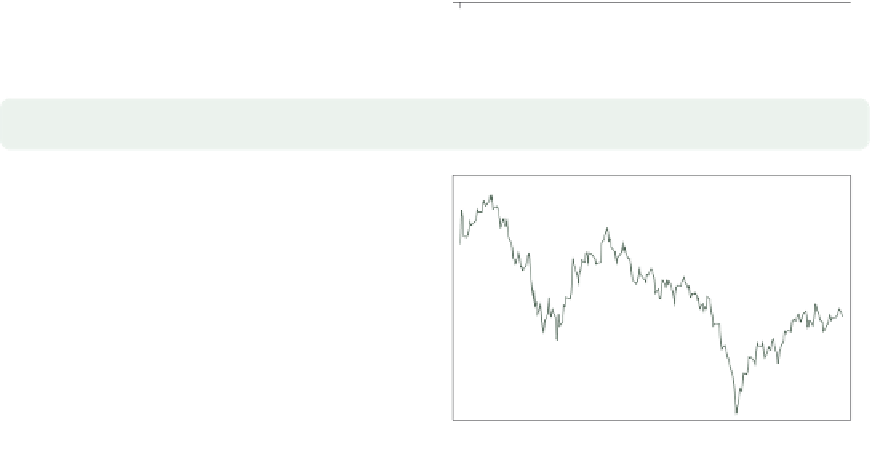
twoway tsline close,
tlabel(01jan2001 31mar2001 30jun2001 30sep2001 01jan2002)
We can use the
tlabel()
option to
label the time points on the time axis.
Note that we specified these dates using
date literals, and Stata knew how to
interpret these and appropriately label
the graph with these values.
Uses sp2001ts.dta & scheme vg s1c
1Jan01
31Mar01
30Jun01
30Sep01
1Jan02
Date
twoway tsline close,
tlabel(01jan2001 30jun2001 01jan2002 )
tmlabel(31mar2001 30sep2001)
We can use the
tmlabel()
option to
include minor labels.
Uses sp2001ts.dta & scheme vg s1c
31Mar01
30Sep01
1Jan01
30Jun01
1Jan02
Date
The electronic form of this topic is solely for direct use at UCLA and only by faculty, students, and staff of UCLA.