Graphics Reference
In-Depth Information
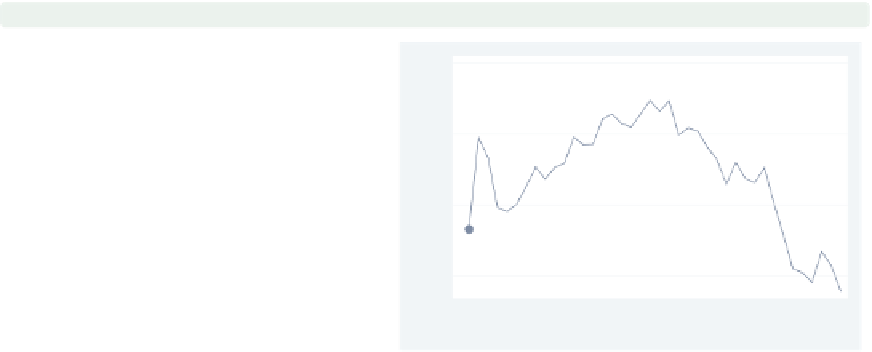
twoway
connected
close tradeday, sort
This
twoway connected
graph is
similar to the
twoway line
graphs we
saw before, except that when you use
connected
, a marker is shown for each
data point.
Uses spjanfeb2001.dta & scheme vg s2c
0
10
20
30
40
Trading day number
twoway
scatter
close tradeday,
connect(l)
sort
This graph is identical to the previous
graph, except this graph is made with
the
scatter
command using the
connect(l)
option. This illustrates the
convenience of using
connected
since
you do not need to manually specify
the
connect()
option.
Uses spjanfeb2001.dta & scheme vg s2c
0
10
20
30
40
Trading day number
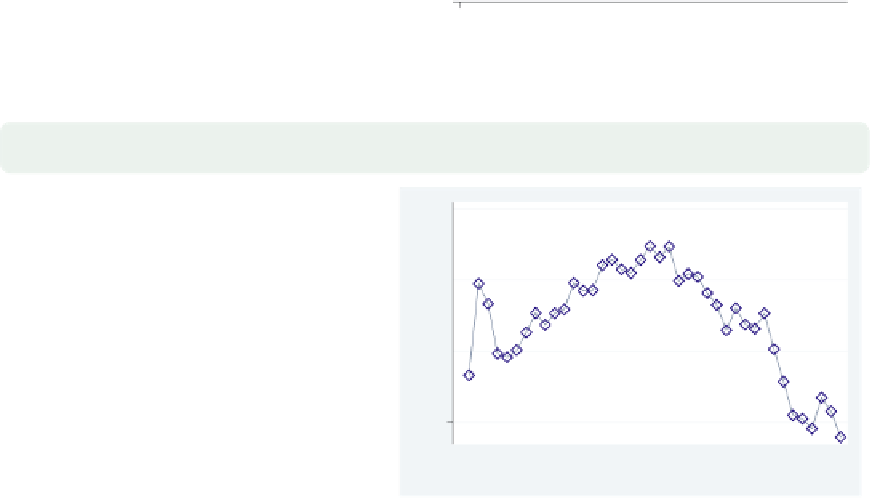
twoway connected close tradeday, sort
msymbol(Dh) mcolor(blue) msize(large)
We can use marker symbol options,
such as
msymbol()
,
mcolor()
,and
msize()
to control the marker symbols.
Here, we make the symbols large, blue,
hollow diamonds. See
Options : Markers
(235) for more examples.
Uses spjanfeb2001.dta & scheme vg s2c
0
10
20
30
40
Trading day number
The electronic form of this topic is solely for direct use at UCLA and only by faculty, students, and staff of UCLA.