Graphics Reference
In-Depth Information
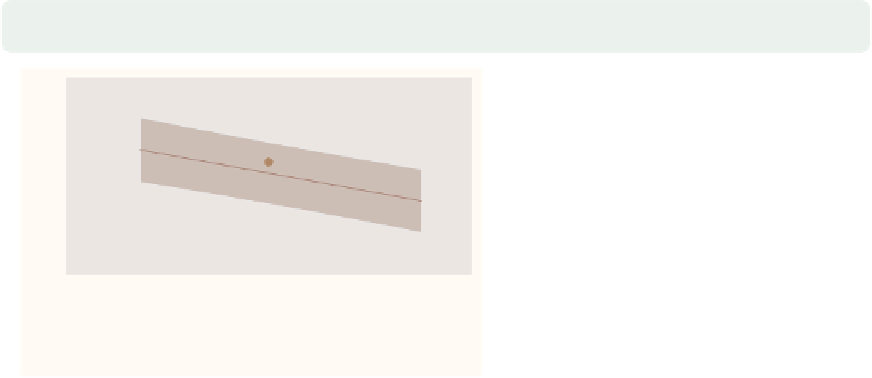
twoway (lfitci ownhome pcturban80, stdf
level(90)
)
(scatter ownhome pcturban80)
We can use the
level()
option to set
the confidence level for the confidence
interval. Here, we make the confidence
level 90%.
Uses allstatesdc.dta & scheme vg rose
90
80
70
60
50
20
40
60
80
100
Percent urban
90% CI
Fitted values
% who own home
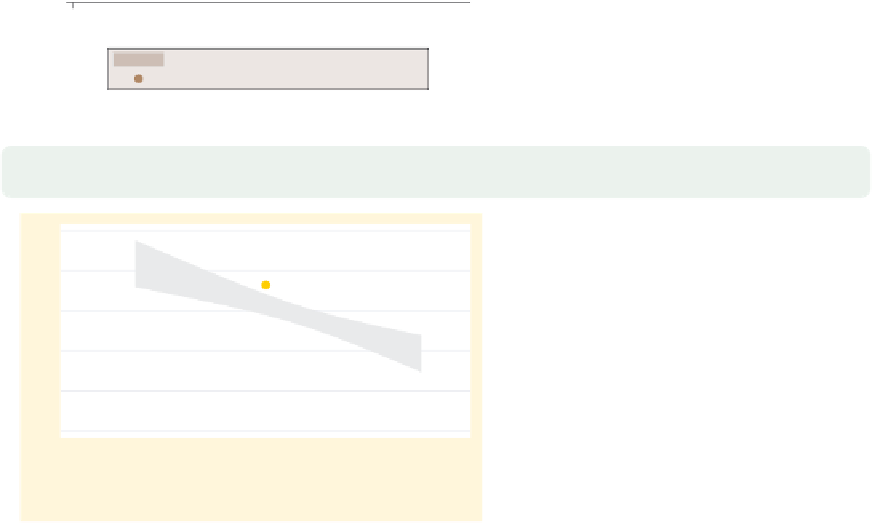
twoway (lfitci ownhome pcturban80,
nofit
)
(scatter ownhome pcturban80)
We now look at how you can control
the display of the fit line. We can use
the
nofit
option to suppress the
display of the fit line. Note that we
have switched to the
vg brite
scheme
for a different look for the graphs.
Uses allstatesdc.dta & scheme vg brite
20
40
60
80
100
Percent urban
95% CI
% who own home
twoway (lfitci ownhome pcturban80,
clpattern(dash) clwidth(thick)
)
(scatter ownhome pcturban80)
You can supply options like
connect()
,
clpattern()
(connect line pattern),
clwidth()
(connect line width), and
clcolor()
(connect line color) to
control how the fit line will be
displayed. Here, we use the
clpattern(dash)
and
clwidth(thick)
options to make the fit line dashed and
thick. See
Options : Connecting
(250) for
more details.
Uses allstatesdc.dta & scheme vg brite
20
40
60
80
100
Percent urban
95% CI
Fitted values
% who own home
The electronic form of this topic is solely for direct use at UCLA and only by faculty, students, and staff of UCLA.