Graphics Reference
In-Depth Information
twoway (
lfitci
ownhome pcturban80) (scatter ownhome pcturban80)
This graph uses the
lfitci
command
to produce a linear fit with confidence
interval. The confidence interval, by
default, is computed using the standard
error of prediction. We overlay this
with a scatterplot.
Uses allstatesdc.dta & scheme vg rose
80
75
70
65
60
55
20
40
60
80
100
Percent urban
95% CI
Fitted values
% who own home
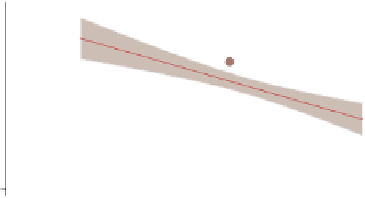
twoway (
scatter
ownhome pcturban80) (
lfitci
ownhome pcturban80)
This example is the same as the
previous example; however, the order of
the
scatter
and
lfitci
commands is
reversed. Note that the order matters
since the points that fell within the
confidence interval are not displayed
because they are masked by the
shading of the confidence interval.
Uses allstatesdc.dta & scheme vg rose
80
75
70
65
60
55
20.0
40.0
60.0
80.0
100.0
Percent urban
% who own home
95% CI
Fitted values
twoway (lfitci ownhome pcturban80,
stdf
)
(scatter ownhome pcturban80)
Here, we add the
stdf
option, which
computes the confidence intervals using
the standard error of forecast. If
samples were drawn repeatedly, this
confidence interval would capture 95%
of the observations. With 50
observations, we would expect 2 or 3
observations to fall outside of the
confidence interval, and this
corresponds to the data shown here.
Uses allstatesdc.dta & scheme vg rose
90
80
70
60
50
20
40
60
80
100
Percent urban
95% CI
Fitted values
% who own home
The electronic form of this topic is solely for direct use at UCLA and only by faculty, students, and staff of UCLA.